Prevention and Protection - Risk Factors
Context
The Fire and Rescue National Framework for England (.pdf) states that fire and rescue authorities have a responsibility to “identify and assess all foreseeable fire and rescue related risks their communities might face”. One of the three key priorities is to:
“Identify and assess the full range of foreseeable fire and rescue related risks their areas face, make provision for prevention and protection activities and respond to incidents appropriately.”
In July 2017 Her Majesty's Inspectorate of Constabulary and Fire & Rescue Services (HMICFRS) extended its remit to include inspections of England’s fire and rescue services. It now assesses and reports on the efficiency, effectiveness and people of the 45 fire and rescue services in England. As part of the ‘effectiveness’ evaluation, HMICFRS focuses on:
“How well the fire and rescue service understands its current and future risks, works to prevent fires and other risks, protects the public through the regulation of fire safety, responds to fires and other emergencies, and responds to national risks.”
HMICFRS + 'State of Fire'
Improvements required in the way it: Understands the risk; prevents risks; and responds to emergencies
In many services, prevention, protection and response work takes place in isolation
There is an inconsistent approach to identifying risk
Identifying vulnerable members of the community at whom to target fire safety
Understanding risk is fundamental to how FRSs operate
- ‘Risk’ has always been a multi-faceted topic, and a word that would have 50 different definitions from 50 different fire services.
- While there are national plans to unify FRSs approach, individual services will retain responsibility for determining how ‘risk’ informs their CRMP.
- Services need to be sensitive and responsive to local risk including understanding when and where demand may be at its highest to make sure that enough resources are available and to target community safety.
Scope
- Consult with NFRS to identify:
- Incident types to assess in the project
- Data sources to evaluate risk
- Collect, cleanse, and assess data suitability for use in the project.
- Undertake modelling to identify the characteristics with the strongest relationships to the likelihood of incidents occurring at LSOA level.
- Use UPRN level data to explore characteristics associated with dwelling fires.
- Use incident level descriptive factors and explore their relationship to different consequence measures.
Objectives
- The overall objective is to evidence and quantify risk
- Highlight factors that do and do not strongly align to risk
Approach
LSOA Level Assessment
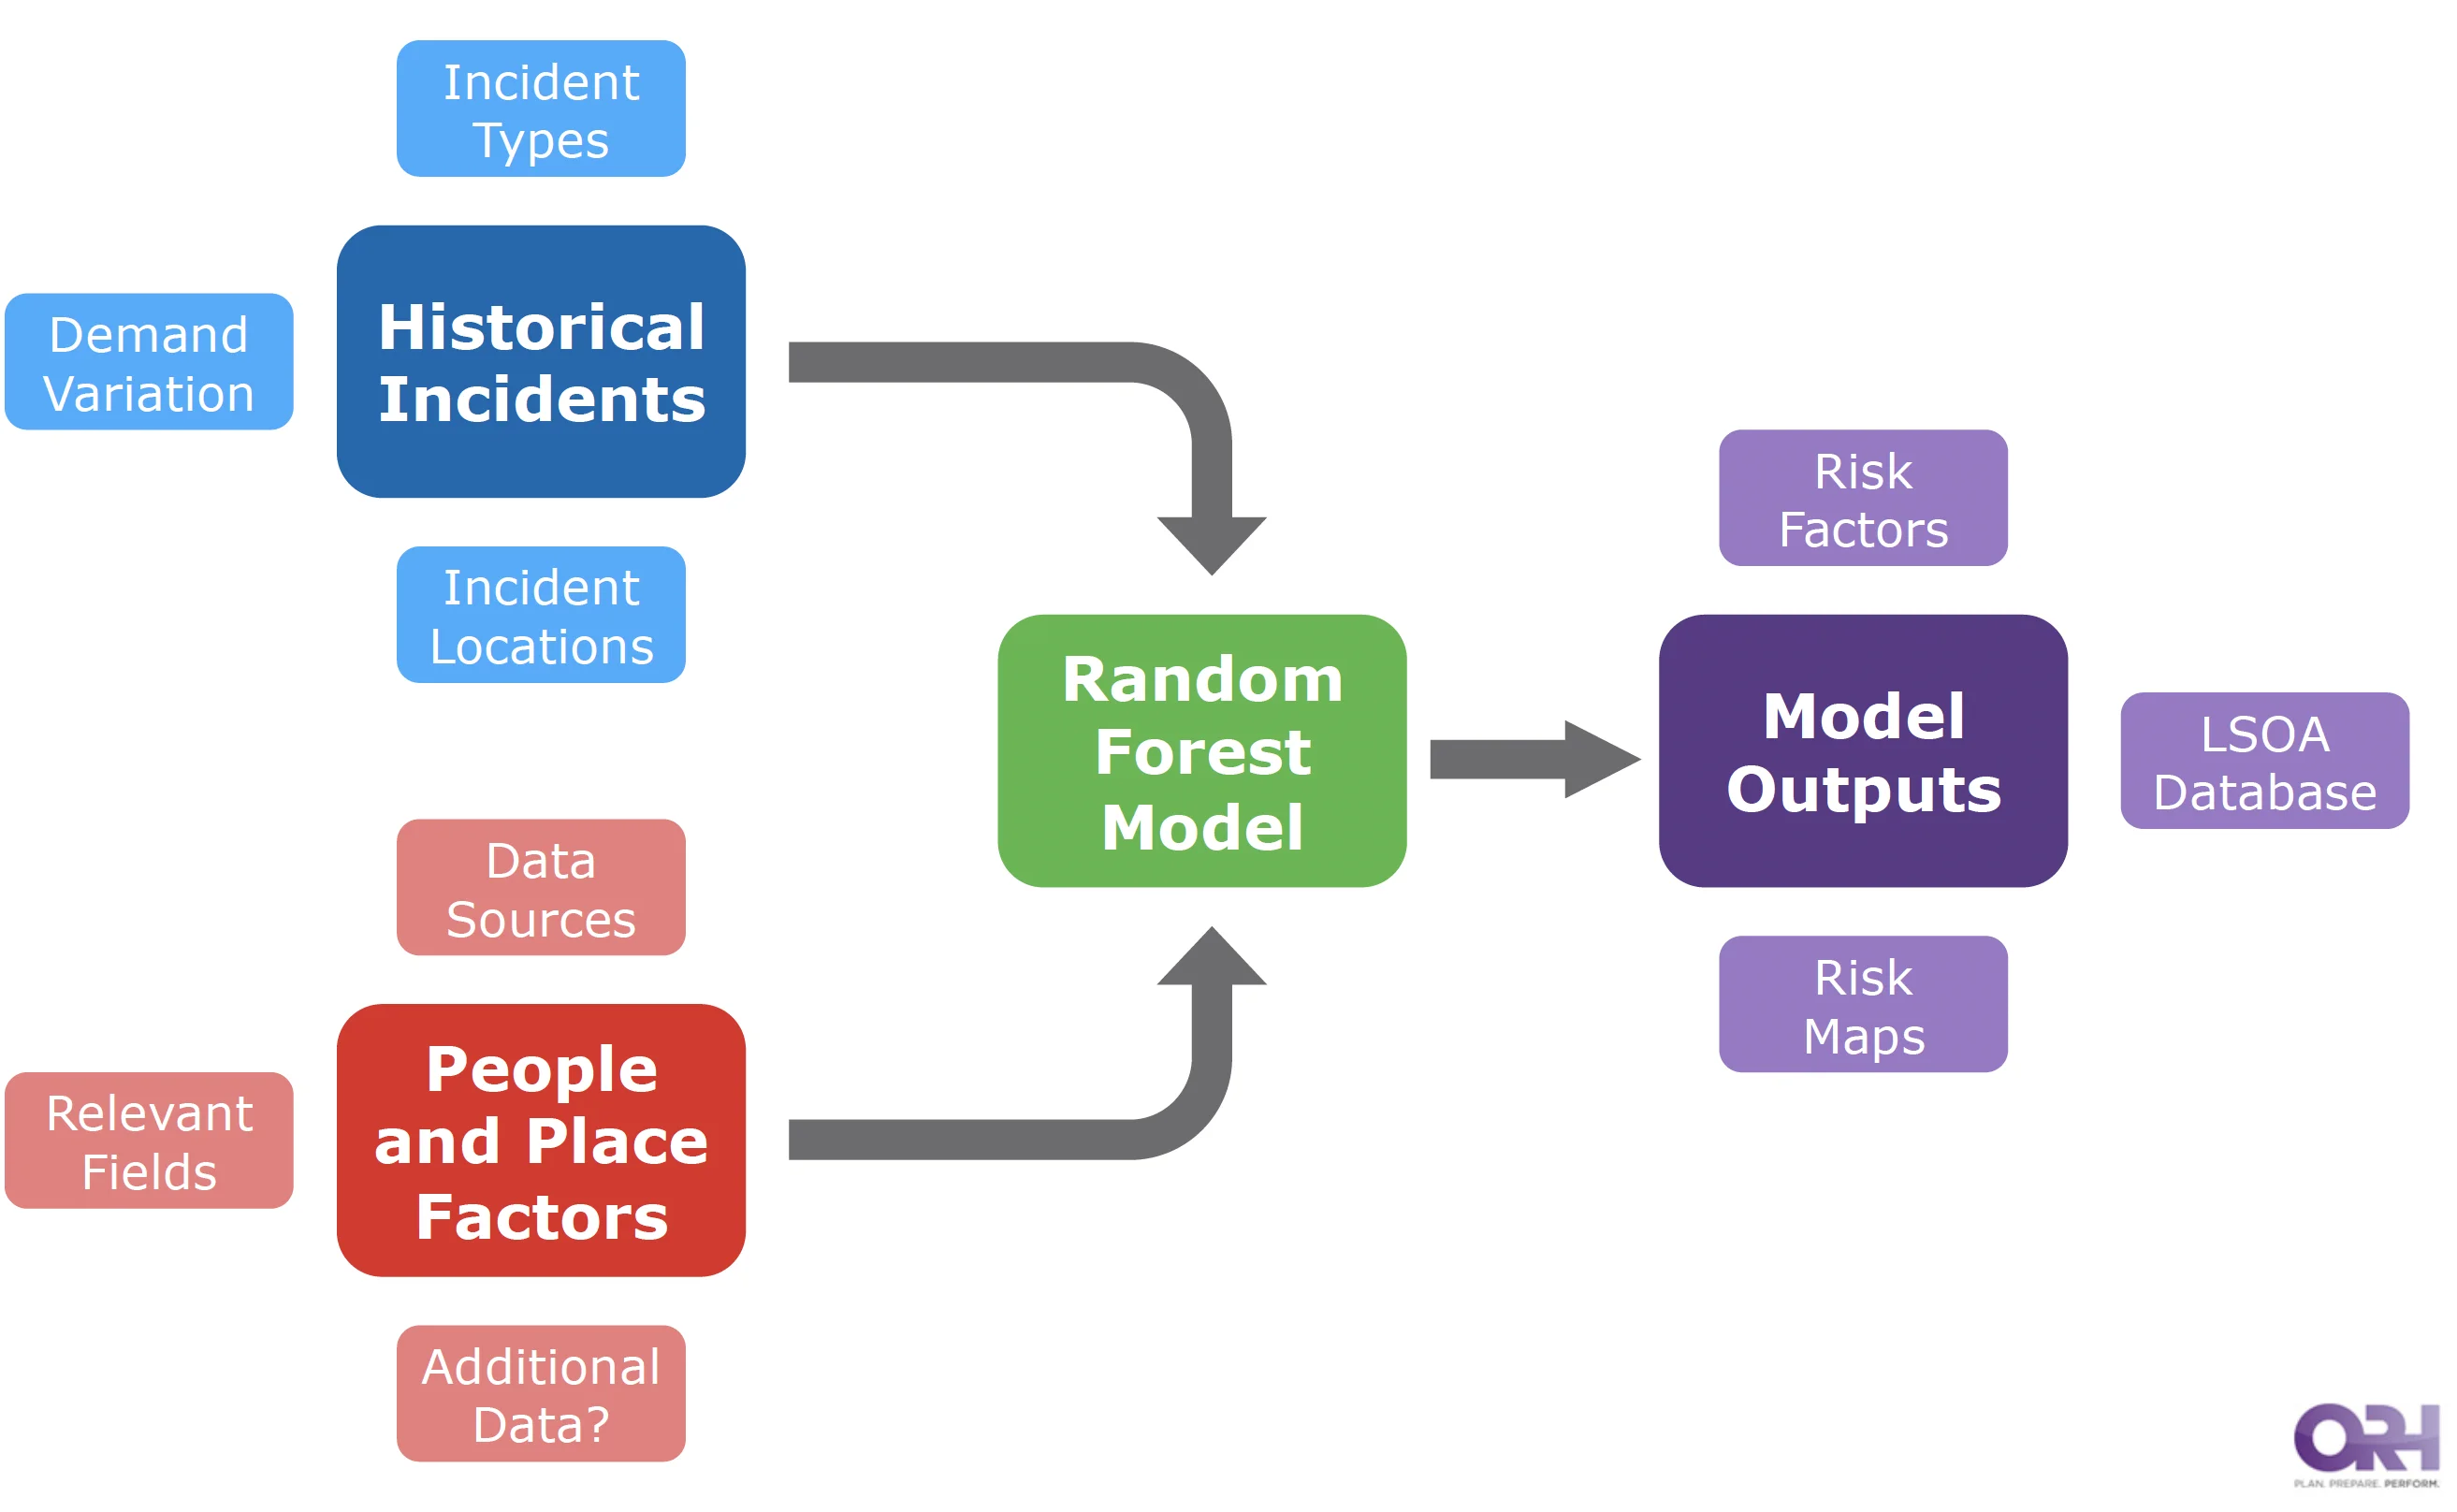
ORH worked with NFRS to identify the incident categories that NFRS must plan for, taking account of differences in the frequency, location and consequence of incidents.
For each category, ORH sought to identify the likelihood of an incident occurring by LSOA in Nottinghamshire through analysis and modelling. This was based on a wide range of suitable data sources where there may be a link to the likelihood of incidents.
ORH created a database of all LSOAs in Nottinghamshire, populated with the historical incident data and all potential data sources, building up an extensive profile of every LSOA.
ORH applied Random Forest modelling and statistical analysis to identify which factors were good indicators for the likelihood of each of the different risk categories. The outputs from this work included:
- Ranked list of contributory factors to likelihood of incidents
- A database of LSOA risk for each incident category
Overview
Historical Incidents
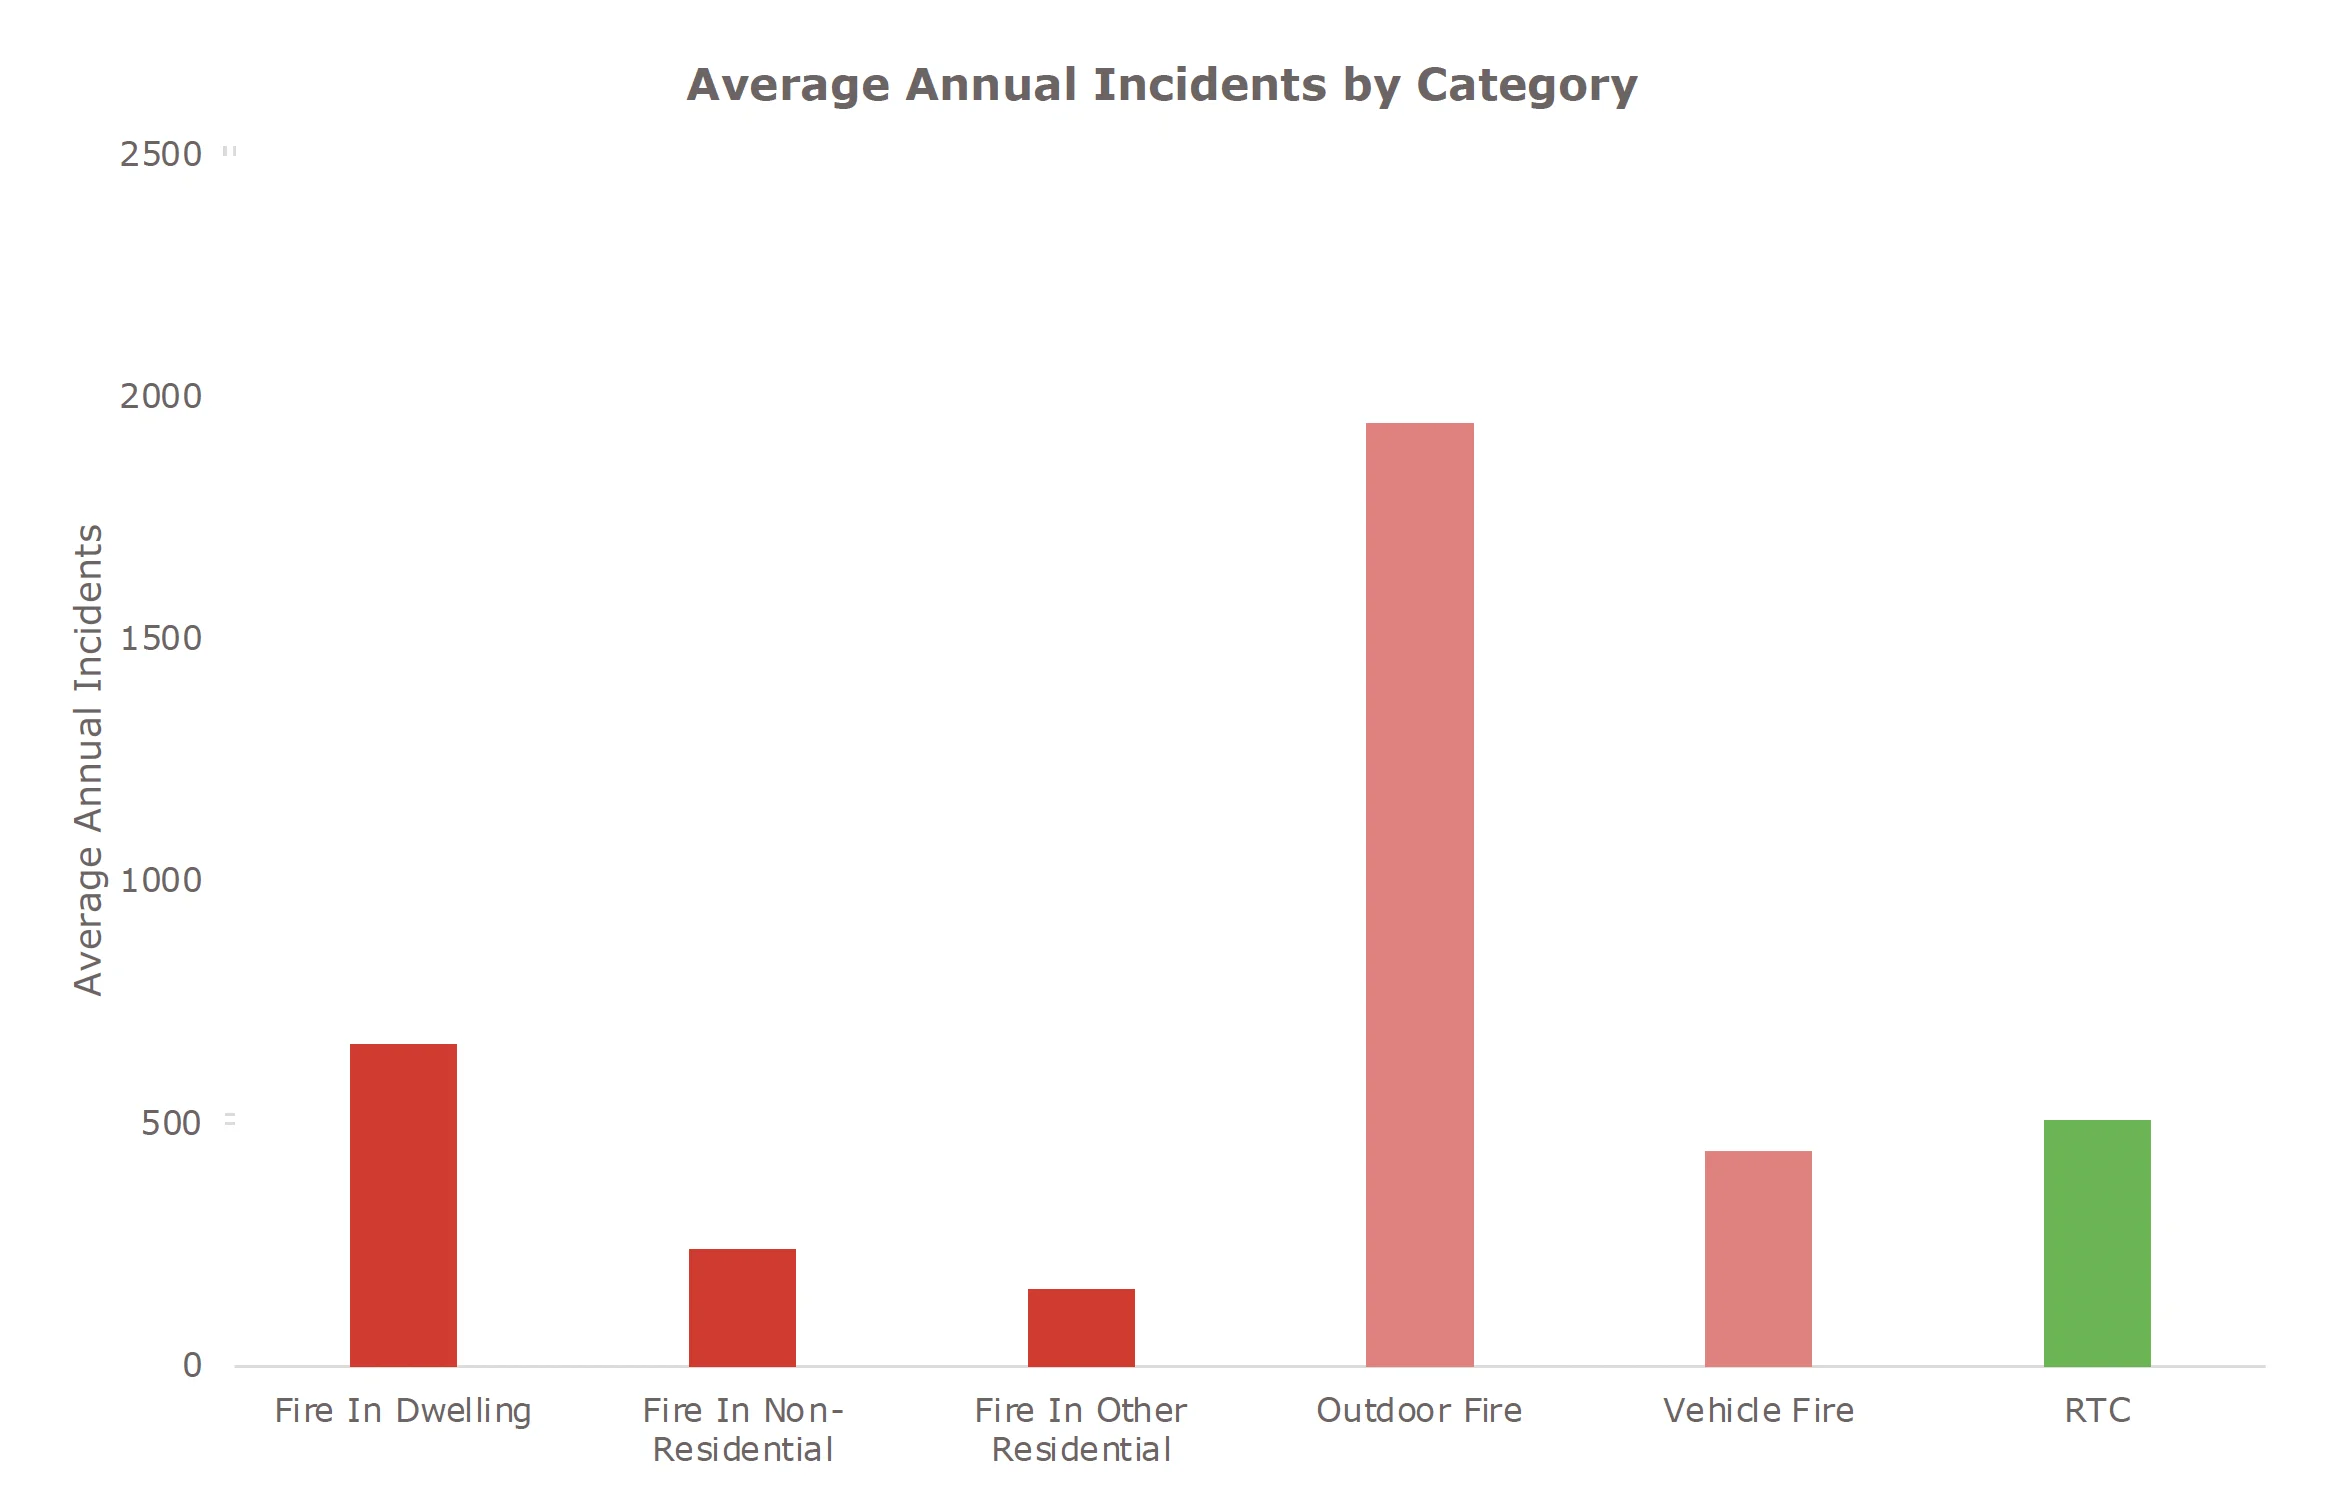
ORH worked with NFRS to identify the incident categories that NFRS must plan for. These needed to be broad enough to be relatively likely to occur and would cause negative outcomes to people, property or infrastructure.
Distinct categories are required when there are differences in the likelihood of where incidents occur (geographical location) and/or the consequences of an incident. For example, where fires occur is very different from where RTCs occur, and the outcomes of these incidents are also very different.
NFRS provided incident and response data for the period January 2011 to December 2020.
Incident Categories
People and Place Factors
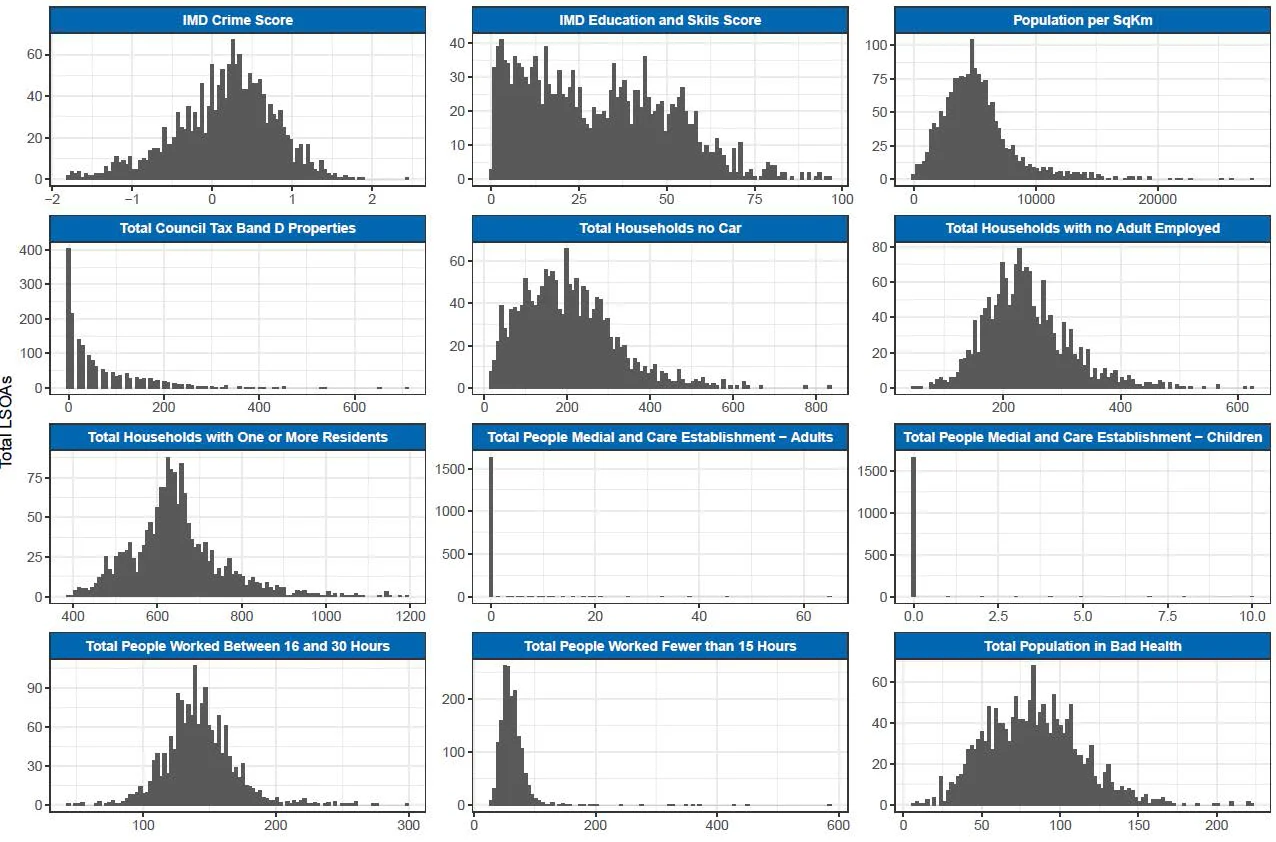
In order to profile areas and identify characteristics in terms of their relationship to the likelihood of where incidents occur, ORH populated a database of all Lower Super Output Areas (LSOAs) with many datasets. This was mainly publicly available data at LSOA level but also data supplied by NFRS.
- IMD
- Health
- Income
- Crime
- EPC
- Energy Rating
- Building Age
- Tenancy
- Census
- Occupation
- Car Ownership
- Education
- ONS
- Population
- House Prices
- Council Tax Bands
- Mosaic
- Population Characteristics
- Grand Index
- Other Data
- Roads
- Geography
- Boundaries
Data Sources
- Population Data: ORH used Office of National Statistics (ONS) data to calculate the population by age and gender.
- Deprivation Data: Index of Multiple Deprivation (IMD) 2019 data (from the MCLHG) was used to quantify and rank many different characteristics of deprivation.
- Road Network Data: ORH holds detailed road network mapping data (including speed limits, road types and length) sourced from HERE.
- Housing Data: Housing data from ONS was used to determine household occupancy and the value of houses.
- Council Tax Bands: Valuation Office Agency data was used to identify the number of properties in each council tax band and give further data on the distribution of house prices across Nottinghamshire.
- Domestic Building Data: ORH used Energy Performance Certificate (EPC) data from MCHLG to evaluate property characteristics. This data was only available for a proportion of properties.
Selecting Relevant Data Fields
ORH collated over 500 data fields into a single database to provide a detailed description of each LSOA in Nottinghamshire.
Before commencing the modelling, we analysed these fields to gain an understanding of how they fall within NFRS. We then removed irrelevant data, for example, highly correlated fields where two indicators describe something very similar, and skewed data (where almost all LSOAs had a common value).
In total, 160 data fields were taken forward to the statistical modelling.
Random Forest Models
ORH used Random Forest Modelling and statistical analysis to identify which factors are good indicators for each of the different risk categories.
Random Forest Models (RFMs) calculate a risk score by comparing historical incident demand levels and locations with many different combinations of base data variables.
With this comparison, the model determines relationships between variables and the demand pattern. Each variable is ranked based on its individual contribution, enabling the most important factors to be identified.
An area’s final value is an aggregation of the individual variables; the modelling can quantify relationships, but not the characteristics that cause incidents.
An advantage of this approach is that if you can estimate how a factor in an area may change, you can identify how risk may be affected. This could especially be key to prevention and protection work.
Approach
The aim of the RFM was to predict the risk level of every LSOA in Nottinghamshire (as opposed to a precise number of incidents).
The principle was to use machine learning techniques to identify significant patterns within the data that enable us to establish which factors are most closely linked to risk:
- Concept: Form ‘decision trees’ to ask the most pertinent questions that define risk and add information at each step.
- Model Setup: We ‘trained’ the model using a sample of data (80% of LSOAs), using machine learning to identify best questions to ask. Following the sampling, the model was validated against the remaining 20% of LSOAs. This was repeated five times for completeness.
- Outputs: Predicted risk level by LSOA and key characteristics that contribute to risk.
Clustering Data
For each incident type, ORH clustered the LSOAs in Nottinghamshire based on the number of incidents. This was conducted using a clustering algorithm to select appropriate groups.
The key objective of the RFM is to identify the key characteristics that LSOAs in a risk group share with each other, and the importance of these factors in predicting the level of risk.
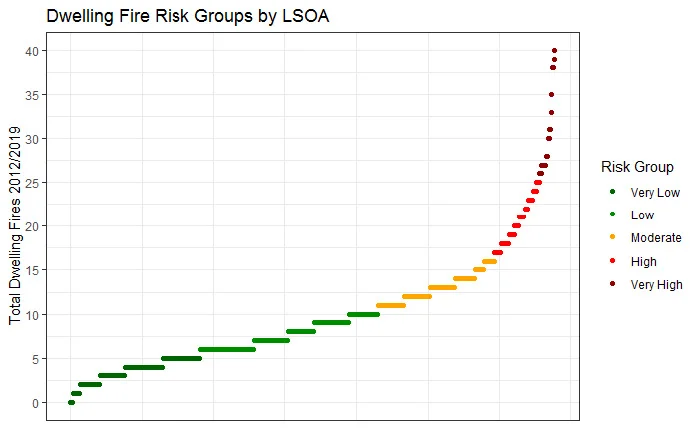
Predicted Risk Level
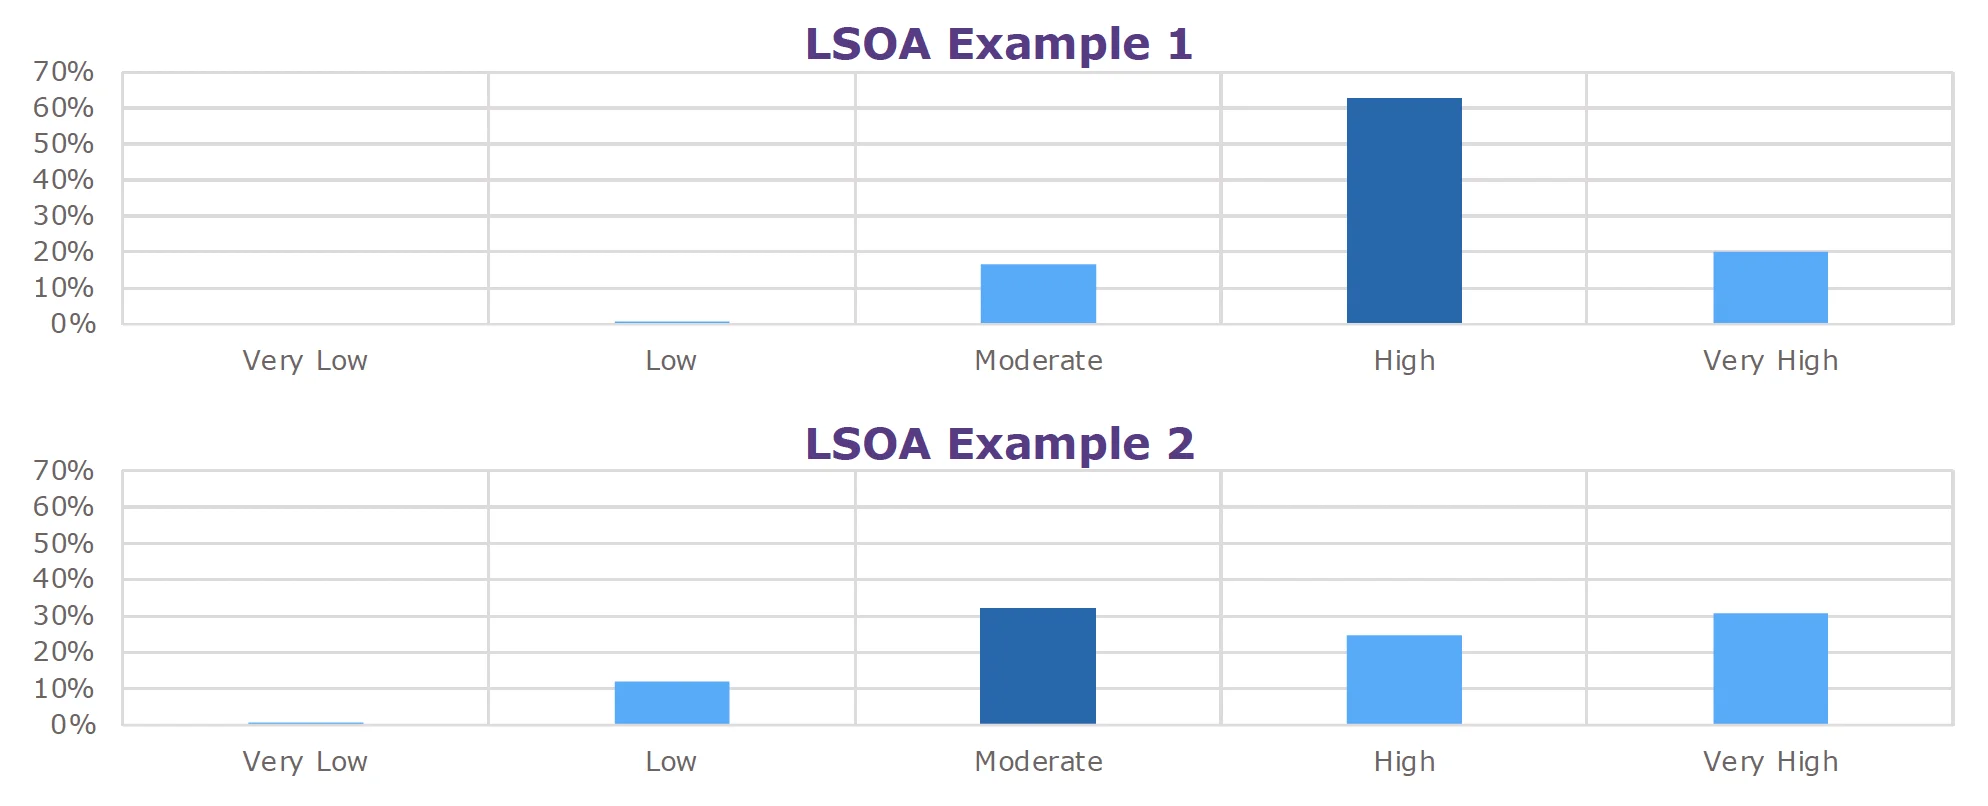
- The output of the RFM for each incident category is a prediction of the risk level for all LSOAs in NFRS, based on the set of characteristics identified as being the most important for classifying the level of risk.
- For each LSOA, a percentage chance is given for the risk group in which it is categorised. In some cases this is a clear result, but other LSOAs could fall into one of several risk groups. For validation, we compared the highest risk category with actual incident numbers.
‘Training’ the Model (Validation)
Samples of the LSOA data were used to train the model to identify what characteristics you might expect in a ‘very high’ to ‘very low’ risk LSOA. All LSOAs were then evaluated in this manner to verify that the model has learned the key characteristics.
The model gives each LSOA a percentage chance of being in each group, rather than an absolute decision. There is a good alignment between ‘actual’ and predicted risk by LSOA:
- For Dwelling Fires, 94% of LSOAs are in the same actual group or one category above or below
| Confusion Matrix | Predicted Group | |||||
|---|---|---|---|---|---|---|
| Very Low | Low | Moderate | High | Very high | ||
| Actual Group | Very low | 101 | 74 | 6 | 1 | 0 |
| Low | 51 | 134 | 54 | 8 | 1 | |
| Moderate | 5 | 63 | 61 | 26 | 8 | |
| High | 0 | 4 | 40 | 12 | 8 | |
| Very high | 0 | 0 | 6 | 6 | 10 | |
There is good alignment between ‘actual’ and predicted risk by LSOA; this provides confidence that the model can be used to identify which characteristics have the strongest relationship to incidents occurring.
Model Outputs
In the RFM, each characteristic is ranked based on the strength of its relationship to the risk measure. This allowed ORH to refine the model by discounting variables with a weak relationship to the historical incident pattern.
After removing these variables, the model was run for a second time to ensure that there was no significant loss to the explanatory power, and that the final group of variables accurately described the observed data.
Once the characteristics with the strongest relationship to the likelihood of incidents occurring were identified, they were combined to determine the risk score for that LSOA. Risk scores are presented relative to the highest risk LSOA for that incident/risk type.
The following sections are the outputs from the RFM, which aims to build a picture of risk through the combination of factors. Full results are provided in a separate database for each incident category.
LSOA Results
- Full results are provided in separate databases of all LOSAs, covering:
- A percentile grouping for each of the top ten variables
- The number of historical incidents
- The probability that the LSOA is Very Low to Very High risk and the most likely grouping for the LSOA
- For each potential risk factor, the LSOAs are clustered into groups (Top 1%, Top 5%, etc) based on their analysed value for this factor.
- Typically, where an LSOA has higher clusters for inputs, the LSOA will be higher risk. However, it is the combination of all these characteristics (not just the top ten) that produce the prediction of risk.
- Usually the LSOAs with the most incidents are predicted to be Very High or High risk. When this does not occur, it can be because:
- There was one year in the sample with an extraordinary peak in incidents
- The LSOA shares characteristics with a lower risk group