Specialist Appliances
NFRS have asked ORH to conduct a review of certain specialist appliances:
- Specialist Rescue Units (SRU)
- Aerial Ladder Platforms (ALP)
- Command Support Unit (CSU)
- Water and Foam Unit (WFU)
ORH first analysed demand levels and created maps of historical incidents which these specialist vehicles have attended in the last 5 years. ORH have also gathered building heights data from Ordnance Survey to assist with the ALP optimisation.
| Special Appliance Type | Current Number of Appliances | Station | Callsign | No of Incidents |
|---|---|---|---|---|
| Aerial Ladder Platform (ALP) | 2 | Mansfield, London Road | FET01A1, FET03A1 | 548 |
| Specialist Rescue Unit (SRU) | 2 | Newark, Highfields | FET16R1, FET29R1 | 1,174 |
| Command Support Unit | 1 | Mansfield | FET01C1 | 88 |
| Water & Foam Unit (WFU) | 1 | Worksop | FET08W1 | 126 |
| Callsign | Station | Vehichle Type | 2019 | 2020 | 2021 | 2022 | 2023 | Total |
|---|---|---|---|---|---|---|---|---|
| FET01A1 | Mansfield | ALP | 14 | 20 | 27 | 46 | 53 | 160 |
| FET03A1 | London Road | ALP | 35 | 32 | 60 | 90 | 178 | 395 |
| FET16R1 | Newark | SRU | 98 | 91 | 117 | 119 | 136 | 561 |
| FET29R1 | Highfields | SRU | 146 | 103 | 146 | 168 | 171 | 734 |
| FET01C1 | Mansfield | CSU | 9 | 8 | 14 | 29 | 28 | 88 |
| FET08W1 | Worksop | WFU | 2 | 22 | 22 | 62 | 18 | 126 |
| Total | 304 | 276 | 386 | 514 | 584 | 2,064 | ||
| Special Rescue Type | 2019 | 2020 | 2021 | 2022 | 2023 | Total |
|---|---|---|---|---|---|---|
| Animal Rescue | 67 | 57 | 71 | 80 | 62 | 337 |
| Water Rescue | 52 | 32 | 39 | 37 | 58 | 218 |
| Rescue from Height | 12 | 5 | 9 | 6 | 6 | 38 |
| Total | 131 | 94 | 119 | 123 | 126 | 593 |
Special Rescue Incident definition is detailed below
| MobIncType | Specialist Rescue Type |
|---|---|
| Rescue Large Animal P3 | Animal Rescue |
| Rescue Small Animal P3 | Animal Rescue |
| Rescue Small Animal From Water P3 | Animal Rescue |
| Rescue Large Animal From Height P3 | Animal Rescue |
| Rescue Small Animal From Height P3 | Animal Rescue |
| Rescue Large Animal From Unstable Surface P3 | Animal Rescue |
| Rescue Large Animal From Water P3 | Animal Rescue |
| Water Rescue Swift P1 | Water Rescue |
| Water Rescue Lakes/Ponds P1 | Water Rescue |
| Suicide Threat To Jump Into Water P1 | Water Rescue |
| Water Rescue Vehichle Flood Water P1 | Water Rescue |
| Rescue From Height P1 | Rescue From Height |
Demand Maps
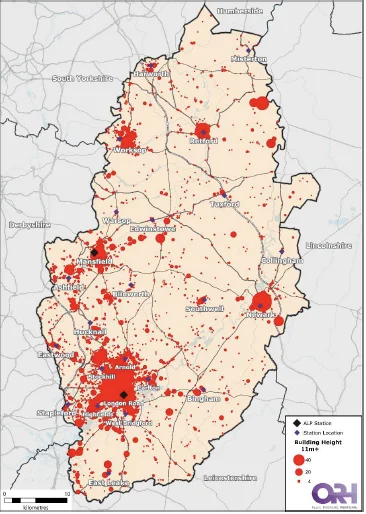
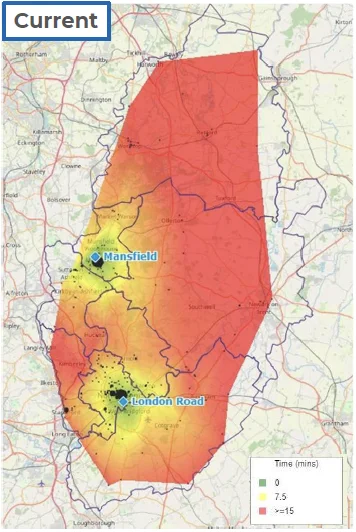
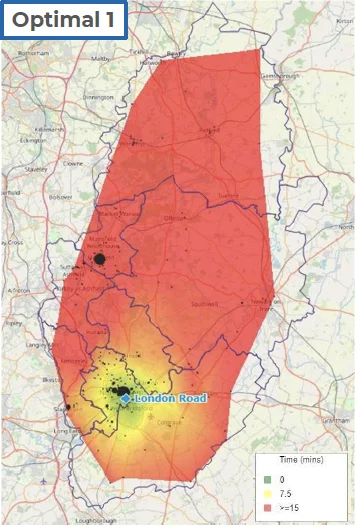
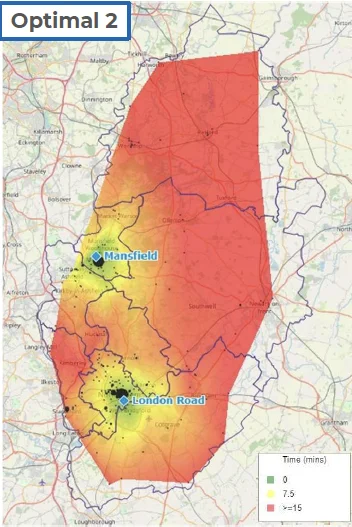
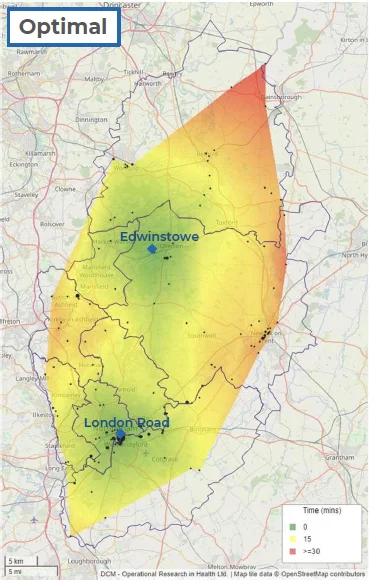
OS Building Heights Over 10 Meters - Optimised Locations
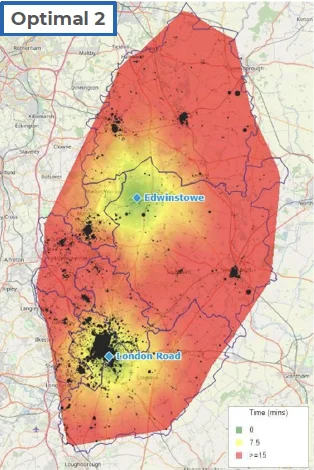
Building Height - Optimised Locations
| Deployment | Mean Coverage | Percentiles | % in 15 minutes | ||
|---|---|---|---|---|---|
| 50% | 75% | 90% | |||
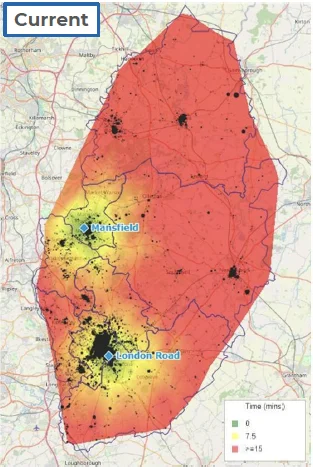
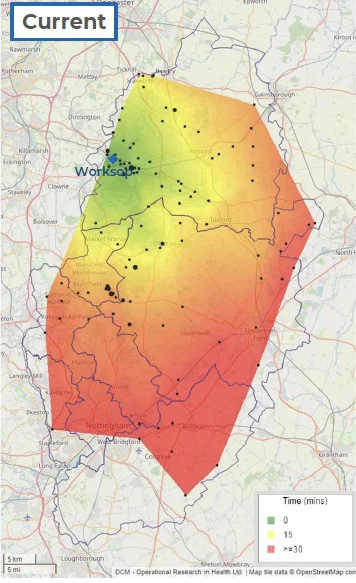
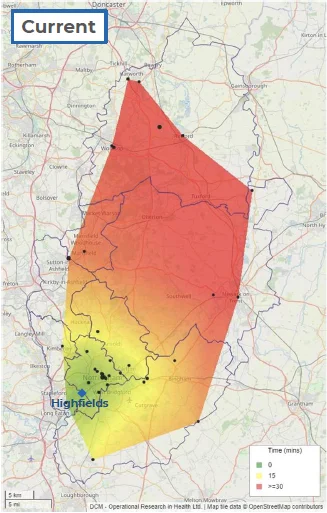
| Current: London Road, Mansfield | 09:28 | 05:54 | 11:44 | 22:49 | 81.8% |
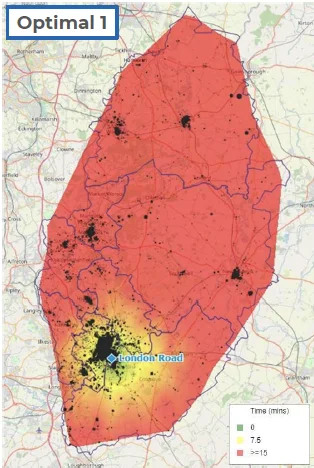
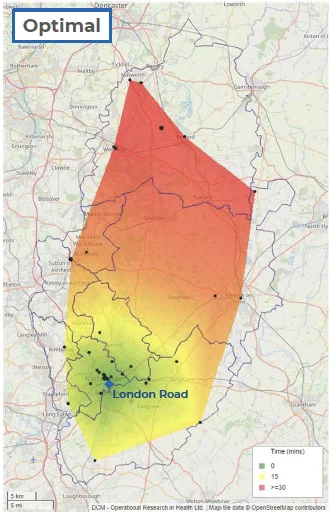
| Optimal 1 Stn: London Road | 12:52 | 06:39 | 20:44 | 33:09 | 69.6% |
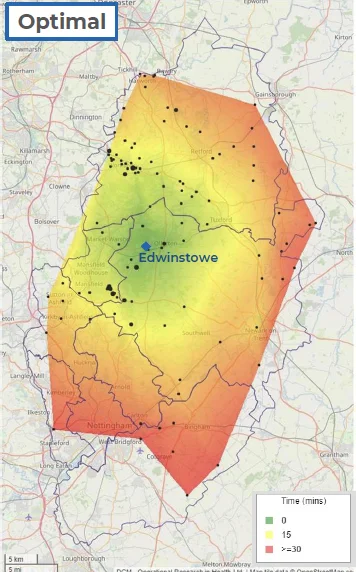
| Optimal 2 Stns: London Road, Edwinstowe | 09:06 | 06:34 | 12:49 | 17:39 | 81.6% |
| Region | Current | Optimal 1 Station | Optimal 2 Stations | 11m+ Buildings |
|---|---|---|---|---|
| Ashfield | 10:48 | 19:16 | 16:43 | 804 |
| Bassetlaw | 25:55 | 40:39 | 17:00 | 1,614 |
| Broxtowe | 11:19 | 11:20 | 11:20 | 851 |
| City of Nottingham | 05:06 | 05:06 | 05:06 | 8,747 |
| Gedling | 09:01 | 10:25 | 10:22 | 795 |
| Mansfield | 03:56 | 23:52 | 11:37 | 978 |
| Newark & Sherwood | 21:10 | 24:31 | 17:18 | 1,349 |
| Rushcliffe | 08:46 | 08:46 | 08:46 | 1,299 |
| All Regions | 09:28 | 12:52 | 09:06 | 16,437 |
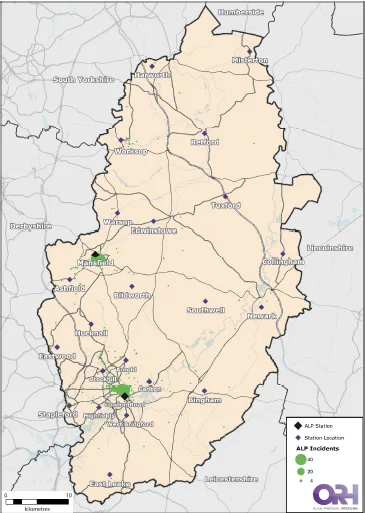
ALP Historical Responses - Optimised Locations
ALP - Optimised Location (1 and 2 Stations)
| Deployment | Mean Coverage | Percentiles | % in 15 minutes | ||
|---|---|---|---|---|---|
| 50% | 75% | 90% | |||
| Current: London Road, Mansfield | 06:00 | 03:39 | 06:59 | 11:59 | 93.1% |
| Optimal 1 Stn: London Road | 10:47 | 05:24 | 21:54 | 23:14 | 70.6% |
| Optimal 2 Stns: London Road, Edwinstowe | 06:00 | 03:39 | 06:59 | 11:59 | 93.1% |
| Region | Current | Optimal 1 Station | Optimal 2 Stations | 5-year Demand |
|---|---|---|---|---|
| Ashfield | 08:14 | 21:42 | 08:14 | 22 |
| Bassetlaw | 25:27 | 40:43 | 25:27 | 19 |
| Broxtowe | 12:19 | 12:19 | 12:19 | 19 |
| City of Nottingham | 04:07 | 04:07 | 04:07 | 335 |
| Gedling | 08:09 | 08:09 | 08:09 | 13 |
| Mansfield | 03:20 | 23:08 | 03:20 | 98 |
| Newark & Sherwood | 17:24 | 22:25 | 17:24 | 18 |
| Rushcliffe | 11:13 | 11:13 | 11:13 | 24 |
| All Regions | 06:00 | 10:47 | 06:00 | 548 |
Demand Maps
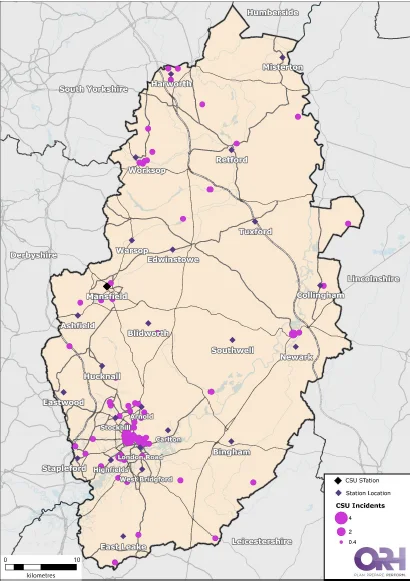
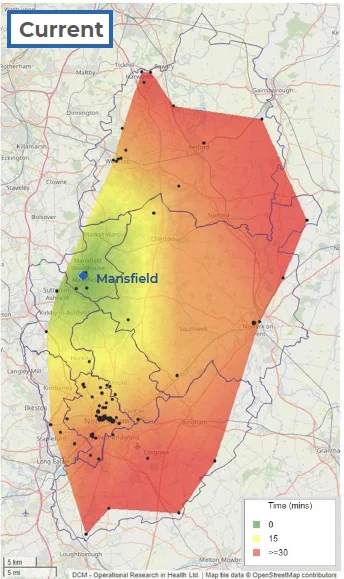
Command Support Unit Historical Responses - Optimised Location
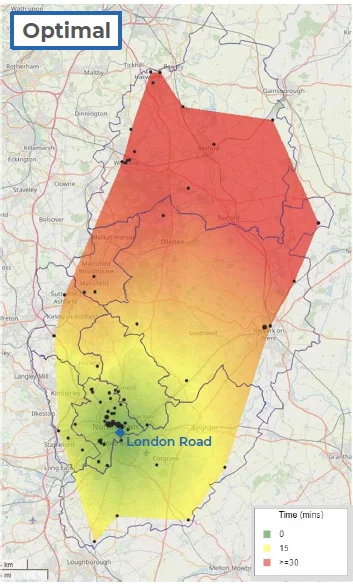
The optimal site is selected at London Road
| Deployment | Mean Coverage | Percentiles | % in 30 minutes | ||
|---|---|---|---|---|---|
| 50% | 75% | 90% | |||
| Current - Mansfield | 22:53 | 22:44 | 25:19 | 32:04 | 87.5% |
| Optimal - London Road | 14:24 | 08:09 | 21:39 | 39:40 | 81.8% |
| Region | Current | Optimal | 5-year Demand |
|---|---|---|---|
| Ashfield | 11:44 | 18:52 | 3 |
| Bassetlaw | 26:25 | 41:31 | 13 |
| Broxtowe | 23:07 | 10:46 | 3 |
| City of Nottingham | 22:29 | 05:29 | 49 |
| Gedling | 19:56 | 08:02 | 3 |
| Mansfield | 03:42 | 22:59 | 3 |
| Newark & Sherwood | 24:31 | 25:10 | 8 |
| Rushcliffe | 32:58 | 12:34 | 6 |
| All Regions | 22:53 | 14:24 | 88 |
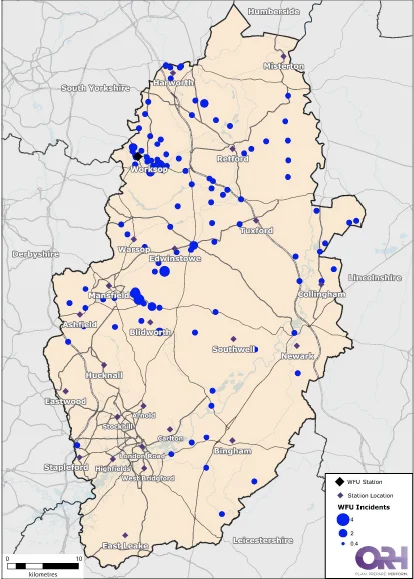
Water & Foam Historical Responses - Optimised Location
The optimal site is selected at Edwinstowe
| Deployment | Mean Coverage | Percentiles | % in 30 minutes | ||
|---|---|---|---|---|---|
| 50% | 75% | 90% | |||
| Current - Worksop | 17:41 | 16:59 | 23:44 | 30:54 | 97.7% |
| Optimal - Edwinstowe | 16:03 | 14:04 | 20:19 | 26:24 | 96.8% |
| Region | Current | Optimal | 5-year Demand |
|---|---|---|---|
| Ashfield | 25:56 | 18:20 | 6 |
| Bassetlaw | 10:17 | 15:52 | 61 |
| Broxtowe | 35:39 | 30:19 | 1 |
| City of Nottingham | 00:00 | 00:00 | 0 |
| Gedling | 38:04 | 26:59 | 1 |
| Mansfield | 21:24 | 12:44 | 16 |
| Newark & Sherwood | 22:15 | 14:02 | 34 |
| Rushcliffe | 40:54 | 29:52 | 6 |
| All Regions | 17:41 | 16:03 | 126 |
Special Rescue Units
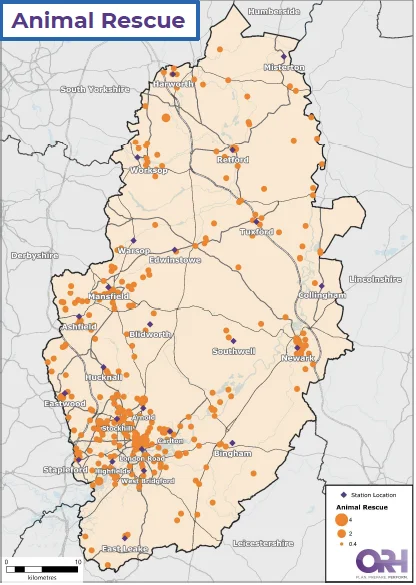
Animal Rescue - Optimised Location
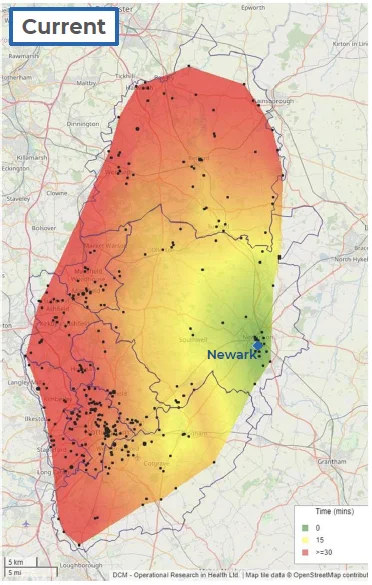
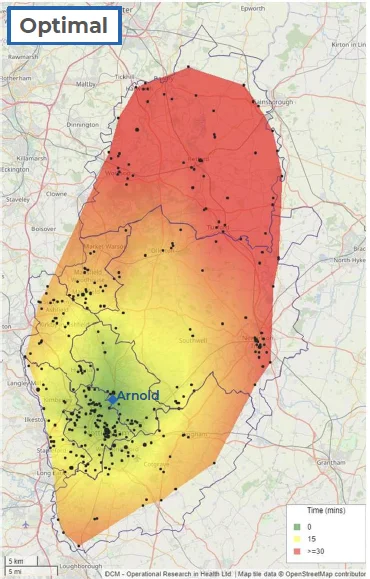
The optimal site is selected at Arnold
| Deployment | Mean Coverage | Percentiles | % in 30 minutes | ||
|---|---|---|---|---|---|
| 50% | 75% | 90% | |||
| Current - Newark | 25:01 | 26:44 | 30:34 | 32:54 | 71.8% |
| Optimal - Arnold | 17:39 | 15:09 | 23:29 | 33:44 | 84.0% |
| Region | Current | Optimal | 5-year Demand |
|---|---|---|---|
| Ashfield | 31:30 | 16:18 | 31 |
| Bassetlaw | 27:20 | 35:45 | 51 |
| Broxtowe | 33:27 | 14:08 | 29 |
| City of Nottingham | 27:27 | 07:55 | 86 |
| Gedling | 23:57 | 07:09 | 22 |
| Mansfield | 26:53 | 18:15 | 29 |
| Newark & Sherwood | 11:35 | 24:16 | 49 |
| Rushcliffe | 21:35 | 15:50 | 39 |
| All Regions | 25:01 | 17:39 | 337 |
Large Animal Rescue Only - Optimised Location
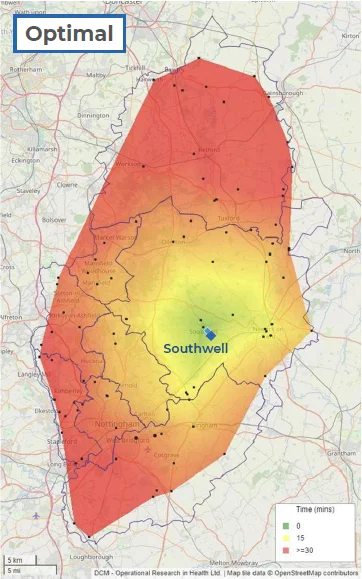
The optimal site is selected at Southwell
| Deployment | Mean Coverage | Percentiles | % in 30 minutes | ||
|---|---|---|---|---|---|
| 50% | 75% | 90% | |||
| Current - Newark | 23:09 | 23:19 | 31:54 | 34:49 | 66.3% |
| Optimal - Southwell | 22:22 | 21:54 | 26:49 | 34:24 | 89.3% |
| Region | Current | Optimal | 5-year Demand* |
|---|---|---|---|
| Ashfield | 32:43 | 24:35 | 7 |
| Bassetlaw | 27:29 | 30:56 | 19 |
| Broxtowe | 34:13 | 28:22 | 10 |
| City of Nottingham | 29:07 | 21:21 | 5 |
| Gedling | 24:12 | 15:46 | 3 |
| Mansfield | 26:56 | 20:28 | 6 |
| Newark & Sherwood | 12:30 | 14:00 | 26 |
| Rushcliffe | 21:14 | 23:31 | 15 |
| All Regions | 23:09 | 22:22 | 92 |
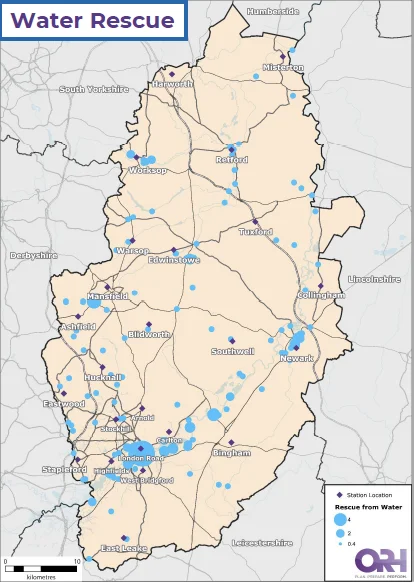
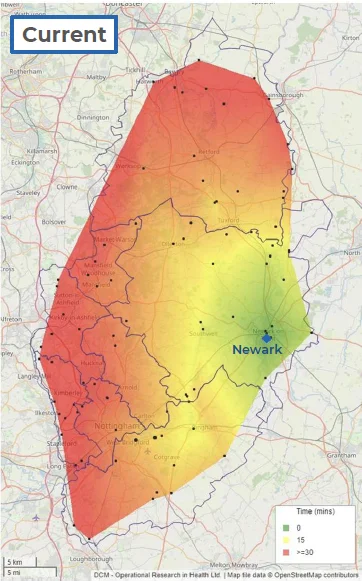
Water Rescue - Optimised Location
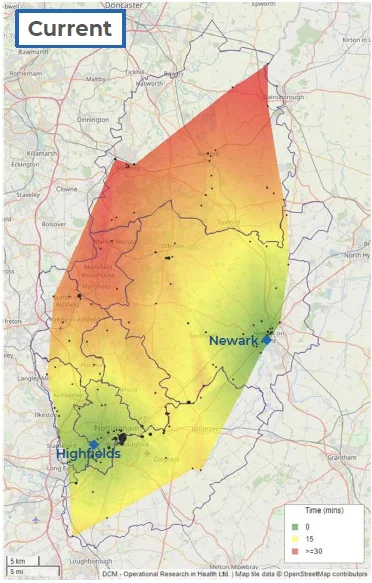
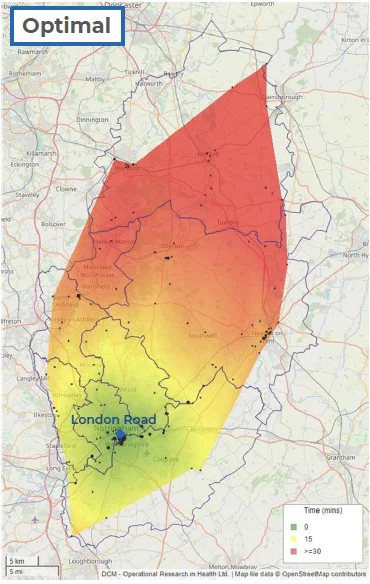
The optimal site is selected at London Road
| Deployment | Mean Coverage | Percentiles | % in 30 minutes | ||
|---|---|---|---|---|---|
| 50% | 75% | 90% | |||
| Current | 13:08 | 10:29 | 18:29 | 24:19 | 97.7% |
| Optimal - London Road & Edwinstowe | 15:21 | 12:54 | 23:19 | 35:19 | 86.2% |
| Region | Current | Optimal | 5-year Demand |
|---|---|---|---|
| Ashfield | 22:16 | 21:12 | 14 |
| Bassetlaw | 26:06 | 39:39 | 25 |
| Broxtowe | 10:02 | 13:31 | 13 |
| City of Nottingham | 07:43 | 03:36 | 58 |
| Gedling | 16:01 | 11:19 | 10 |
| Mansfield | 27:47 | 28:19 | 3 |
| Newark & Sherwood | 11:05 | 23:08 | 51 |
| Rushcliffe | 11:35 | 06:43 | 44 |
| All Regions | 13:08 | 15:21 | 218 |
Water Rescue - Optimised Locations
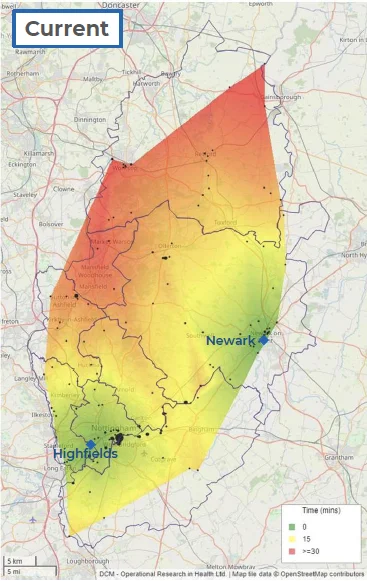
The optimal sites are selected at London Road and Edwinstowe
| Deployment | Mean Coverage | Percentiles | % in 30 minutes | ||
|---|---|---|---|---|---|
| 50% | 75% | 90% | |||
| Current | 13:08 | 10:29 | 18:29 | 24:19 | 97.7% |
| Optimal - London Road & Edwinstowe | 10:21 | 09:59 | 15:29 | 19:54 | 99.5% |
| Region | Current | Optimal | 5-year Demand |
|---|---|---|---|
| Ashfield | 22:16 | 16:13 | 14 |
| Bassetlaw | 26:06 | 15:59 | 25 |
| Broxtowe | 10:02 | 13:31 | 13 |
| City of Nottingham | 07:43 | 03:36 | 58 |
| Gedling | 16:01 | 11:19 | 10 |
| Mansfield | 27:47 | 10:24 | 3 |
| Newark & Sherwood | 11:05 | 15:48 | 51 |
| Rushcliffe | 11:35 | 06:43 | 44 |
| All Regions | 13:08 | 10:21 | 218 |
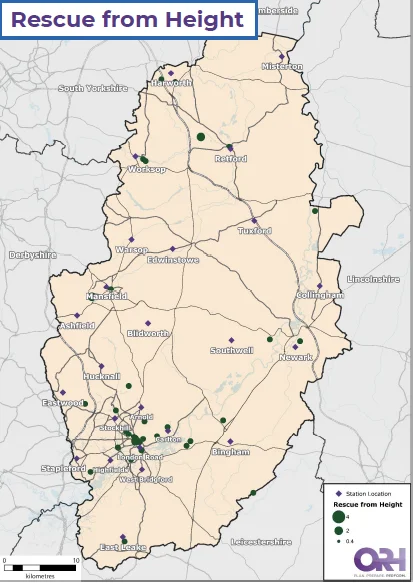
Rescue from Height - Optimised Location
The optimal site is selected at London Road
| Deployment | Mean Coverage | Percentiles | % in 30 minutes | ||
|---|---|---|---|---|---|
| 50% | 75% | 90% | |||
| Current | 19:51 | 13:19 | 30:09 | 43:39 | 73.7% |
| Optimal - London Road | 16:22 | 09:04 | 23:59 | 38:54 | 78.9% |
| Region | Current | Optimal | 5-year Demand |
|---|---|---|---|
| Ashfield | 25:09 | 23:49 | 2 |
| Bassetlaw | 43:28 | 39:58 | 7 |
| Broxtowe | 09:31 | 12:24 | 2 |
| City of Nottingham | 08:20 | 04:42 | 16 |
| Gedling | 14:29 | 10:52 | 2 |
| Mansfield | 26:19 | 23:34 | 1 |
| Newark & Sherwood | 35:01 | 28:59 | 3 |
| Rushcliffe | 17:29 | 12:25 | 5 |
| All Regions | 19:51 | 16:22 | 38 |