Site Search Maps
NFRS asked ORH to produce site search maps for three existing locations of Arnold, Eastwood and Stockhill.
Locations and appliances have been optimised against life risk incidents and all other locations are fixed when looking at each individual station location.
Once optimal locations were found simulation modelling was used to test the impacts on response performance.
Due to the proximity of the optimal locations to their existing locations, and existing locations being already well positioned, impacts on response performance are small
Arnold
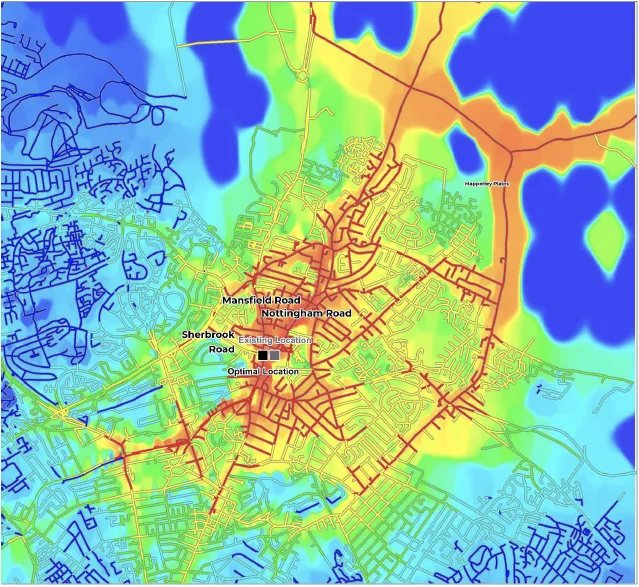
| District | Life Risk Incidents | ||
|---|---|---|---|
|
Average 1st |
Average 2nd | % of 1st in 15 Minutes | |
| Service-Wide | -0:01 | 0:00 | 0.0% |
| Ashfield | 0:00 | -0:01 | 0.0% |
| Bassetlaw | 0:00 | 0:00 | 0.0% |
| Broxtowe | 0:00 | 0:00 | 0.0% |
| City of Nottingham | -0:02 | -0:01 | 0.0% |
| Gedling | 0:00 | -0:01 | -0.1% |
| Mansfield | 0:00 | 0:00 | 0.0% |
| Newark & Sherwood | 0:00 | +0:02 | 0.0% |
| Rushcliffe | 0:00 | 0:00 | 0.0% |
Eastwood
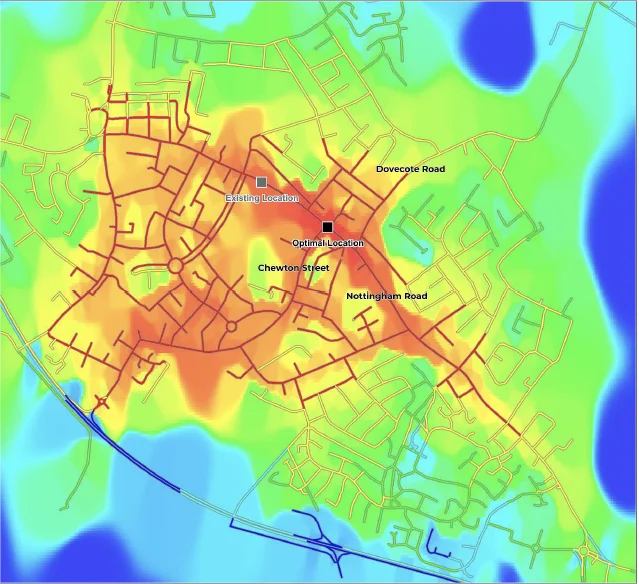
Negligible impact of moving to optimal location
Stockhill
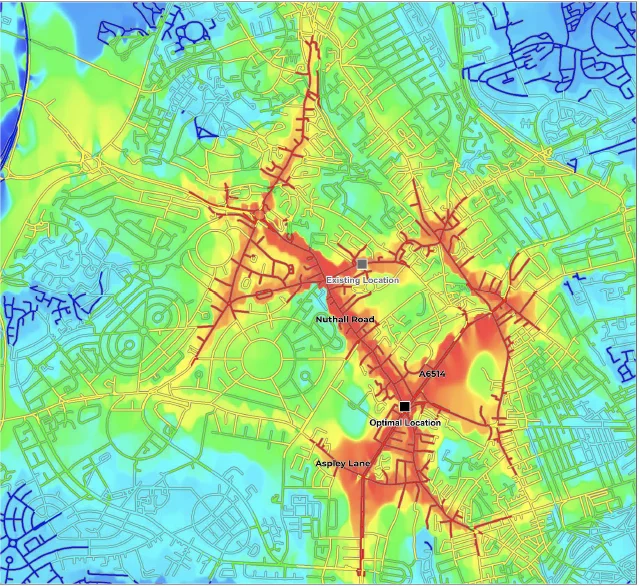
|
District |
Life Risk Incidents | ||
|---|---|---|---|
| Average 1st | Average 2nd | % of 1st in 15 Minutes | |
| Service-Wide | -0:01 | 0:00 | -0.1% |
| Ashfield | +0:01 | +0:18 | -0.1% |
| Bassetlaw | 0:00 | 0:00 | 0.0% |
| Broxtowe | +0:07 | +0:14 | -0.5% |
| City of Nottingham | -0:04 | -0:05 | 0.0% |
| Gedling | +0:03 | +0:12 | -0.4% |
| Mansfield | 0:00 | 0:00 | -0.1% |
| Newark & Sherwood | 0:00 | 0:00 | -0.1% |
| Rushcliffe | -0:01 | -0:02 | 0.1% |