Response and Performance - 2-year Sample (January 2022 to December 2023)
Station Responses by Duty System
Average Daily Responses by Callsign
Pumps Per Incident
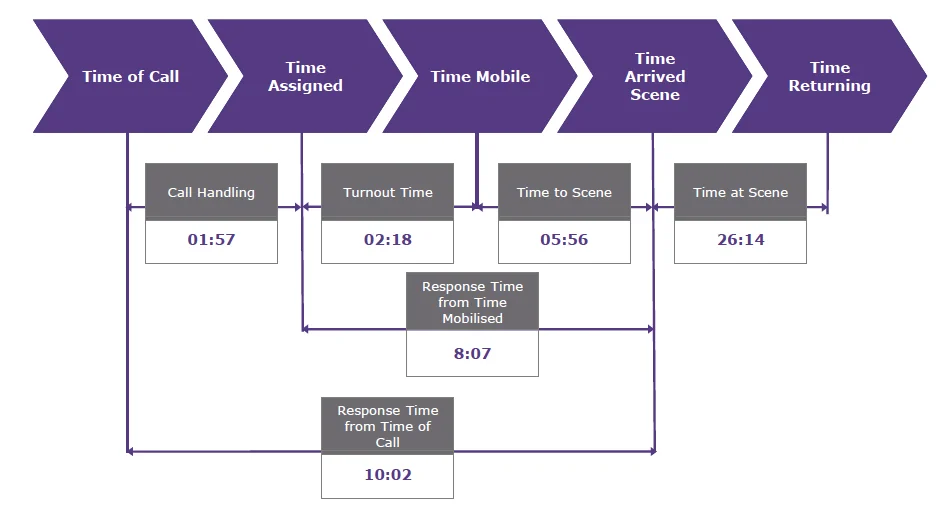
Response Profile: Call Components
For each incident and response, the time stamps associated with the call, incident and responding vehicles were provided. ORH calculated the time intervals to build up a profile of how NFRS responds to incidents. Based on the most recent two calendar years :
- The average time to dispatch the first pump to an incident was 1m 57s
- The average turnout time was 2m 18s, but this varies depending on the duty system and time of day
- The average travel time to scene was 5m 56s, but this varies depending on the proximity to the closest available pumps.
- The average time spent at the scene of the incident was 26m 14s, but this varies depending on the type of incident attended.
While averages are presented and commented on within this report, ORH’s models take account in fluctuations related to observed differences depending on the:
- Time and day
- Type of incident
- Duty system (and individual station) of the pump responding
- Responder number
Call/Incident Cycle Times - 1st Response to All Incidents
Some records do not have complete Time Mobile field. These are still used in calculating the Response Time but not the Turnout Time or Time to Scene.
Call Components by Year - 1st Response to All Incidents
Call Components by Month - 1st Response to All Incidents
Call Components by Hour - 1st Response to All Incidents
Average Turnout Time by Hour and Duty System - 1st Response to All Incidents
5-year Sample (January 2019 to December 2023)
Average Turnout Time by Day/Night
Average Turnout Time by Callsign
Responses to AFA Incidents
| AFA Category | Total Incidents | Total Responses | Average Responses per Incident | Total Occupied Time, hours | Average Occupied Time, mm:ss |
|---|---|---|---|---|---|
| AFA - Hospital | 828 | 990 | 1.2 | 328 | 19:51 |
| AFA - Prison | 36 | 82 | 2.3 | 56 | 40:59 |
| AFA - Hospital & Prison | 864 | 1,072 | 1.2 | 384 | 21:28 |
| AFA - Excluding Hospital & Prison | 5,905 | 8,945 | 1.5 | 3,147 | 21:06 |
| Total AFA | 6,769 | 10,017 | 1.5 | 3,531 | 21:08 |
Responses AFA Hospital and Prison By Callsign
| AFA - Hospital | AFA - Prison | Total | ||||||
|---|---|---|---|---|---|---|---|---|
| Callsign | Station | Duty System | Responses | Occupied Time, mm:ss | Responses | Occupied Time, mm:ss | Responses | Occupied Time, mm:s |
| FET29P1 | Highfields | Wholetime | 337 | 18:53 | 1 | 13:27 | 338 | 18:52 |
| FET26P1 | Arnold | Wholetime | 155 | 18:44 | 3 | 23:57 | 158 | 18:50 |
| FET20P1 | Stockhill | Wholetime | 94 | 21:22 | 4 | 29:05 | 98 | 21:41 |
| FET19P1 | West Bridgford | Wholetime | 75 | 20:56 | 10 | 43:31 | 85 | 23:35 |
| FET03P1 | London Road | Wholetime | 55 | 22:09 | 4 | 41:13 | 59 | 23:27 |
| FET20P2 | Stockhill | Wholetime | 50 | 22:04 | 2 | 25:35 | 52 | 22:12 |
| FET01P1 | Mansfield | Wholetime | 48 | 15:39 | 0 | - | 48 | 15:39 |
| FET16P1 | Newark | Wholetime | 19 | 14:39 | 12 | 42:10 | 31 | 25:18 |
| FET03P2 | London Road | Wholetime | 28 | 19:40 | 1 | 03:37 | 29 | 21:11 |
| FET08P1 | Worksop | Wholetime | 28 | 21:18 | 1 | 47:40 | 29 | 22:12 |
| FET27P1 | Carlton | Wholetime | 11 | 21:25 | 3 | 46:22 | 14 | 26:46 |
| FET06P1 | Edwinstowe | Wholetime | 3 | 46:46 | 3 | 39:58 | 6 | 43:22 |
| FET05P1 | Ashfield | Day Shift Crewing | 44 | 19:32 | 0 | - | 44 | 19:32 |
| FET12P1 | Retford | Day Shift Crewing | 4 | 19:09 | 6 | 49:26 | 10 | 37:19 |
| FET17P1 | Bingham | On-Call | 0 | - | 13 | 41:25 | 13 | 41:25 |
| FET23P1 | Stapleford | On-Call | 9 | 15:26 | 1 | 11:38 | 10 | 15:03 |
| FET12P2 | Retford | On-Call | 3 | 32:12 | 6 | 44:13 | 9 | 40:13 |
| FET05P2 | Ashfield | On-Call | 7 | 22:22 | 0 | - | 7 | 22:22 |
| FET24P1 | Eastwood | On-Call | 5 | 30:58 | 1 | 28:59 | 6 | 30:38 |
| FET16P2 | Newark | On-Call | 4 | 24:26 | 1 | 40:36 | 5 | 27:40 |
| FET25P1 | Hucknall | On-Call | 4 | 24:29 | 1 | 42:01 | 5 | 28:00 |
| FET08P2 | Worksop | On-Call | 3 | 54:24 | 0 | - | 3 | 54:24 |
| FET13P1 | Tuxford | On-Call | 0 | - | 3 | 50:07 | 3 | 50:07 |
| FET15P1 | Collingham | On-Call | 0 | - | 3 | 39:46 | 3 | 39:46 |
| FET02P1 | Blidworth | On-Call | 2 | 25:46 | 0 | - | 2 | 25:46 |
| FET07P1 | Warsop | On-Call | 2 | 19:48 | 0 | - | 2 | 19:48 |
| FET11P1 | Misterton | On-Call | 0 | - | 2 | 47:39 | 2 | 47:39 |
| FET10P1 | Harworth | On-Call | 0 | - | 1 | 42:52 | 1 | 42:52 |
| Total | 990 | 19:51 | 82 | 40:59 | 1072 | 21:28 | ||
Occupied Time is the average time spent by each appliance/crew at an incident (i.e. time difference between time assigned and time available)
Average Response Performance by Incident Category
| Incident Type | 1st Response Average | 2nd Response Average |
|---|---|---|
| Primary Fire - Dwelling | 07:18 | 09:49 |
| Primary Fire - Other Residential | 08:17 | 10:58 |
| Primary Fire - Non-Residential | 08:54 | 12:19 |
| Primary Fire - Other | 09:44 | 13:59 |
| Secondary Fire | 09:04 | 11:55 |
| Chimney Fire | 10:51 | 15:38 |
| False Alarm - AFA Hospital | 06:29 | 08:12 |
| False Alarm - AFA Prison | 12:23 | 17:55 |
| False Alarm - AFA Hospital & Prison | 06:44 | 10:26 |
| False Alarm - AFA Excluding Hospital and Prison | 07:14 | 07:26 |
| False Alarm - Good Intent | 09:10 | 10:12 |
| False Alarm - Malicious | 06:51 | 07:37 |
| Special Service - Other | 07:44 | 15:18 |
| Special Service - RTC | 08:51 | 12:50 |
| Overall Excluding AFA Hospital & Prison | 08:10 | 10:25 |
| Overall | 08:07 | 10:26 |
Mean response time measured from time assigned (Excluding Call Handling)
Average Response Performance by Incident Category - P1 & P2
| Incident Type | 1st Response Average | 2nd Response Average |
|---|---|---|
| Primary Fire - Dwelling | 07:10 | 09:53 |
| Primary Fire - Other Residential | 08:25 | 11:16 |
| Primary Fire - Non-Residential | 09:08 | 12:30 |
| Primary Fire - Other | 09:19 | 13:34 |
| Secondary Fire | 08:39 | 10:15 |
| Chimney Fire | 10:58 | 16:01 |
| False Alarm - AFA Hospital | 06:38 | 08:23 |
| False Alarm - AFA Prison | 10:08 | 15:18 |
| False Alarm - AFA Hospital & Prison | 07:11 | 09:26 |
| False Alarm - AFA Excluding Hospital and Prison | 06:58 | 08:59 |
| False Alarm - Good Intent | 08:12 | 10:15 |
| False Alarm - Malicious | 07:16 | 10:09 |
| Special Service - Other | 06:42 | 14:21 |
| Special Service - RTC | 09:29 | 12:43 |
| Overall Excluding AFA Hospital & Prison | 08:07 | 11:30 |
| Overall | 08:07 | 11:29 |
Mean response time measured from time assigned (Excluding Call Handling)
Average Response Performance by Incident Category - Life Risk
| Incident Type | 1st Response Average | 2nd Response Average |
|---|---|---|
| Primary Fire LR | 07:49 | 10:42 |
| Primary Fire Non LR | 09:44 | 13:59 |
| Secondary & Chimney Fires | 09:06 | 12:07 |
| Primary Fire - Other | 09:44 | 13:59 |
| SS RTC LR | 09:04 | 12:44 |
| SS RTC Non LR | 08:49 | 12:53 |
| SS Other LR | 08:07 | 15:22 |
| SS Other Non LR | 06:50 | 14:56 |
| AFA Hospital | 06:29 | 08:12 |
| AFA Prison | 12:23 | 17:55 |
| AFA NO Hospital & Prison | 07:14 | 07:26 |
| AFA Other | 08:53 | 09:36 |
| Overall Life Risk | 08:02 | 11:41 |
| Overall | 08:07 | 10:26 |
Mean response time measured from time assigned (Excluding Call Handling)
Average Response Performance by Incident Category - Life Risk
1st Response
| 2019 | 2020 | 2021 | 2022 | 2023 | ||||||
|---|---|---|---|---|---|---|---|---|---|---|
| Incident Category | Response Time | N.of Responses | Response Time | N.of Responses | Response Time | N.of Responses | Response Time | N.of Responses | Response Time | N.of Responses |
| Fire Primary LR | 07:14 | 879 | 07:34 | 796 | 07:26 | 831 | 07:32 | 856 | 08:04 | 983 |
| Fire Primary Non LR | 09:12 | 622 | 08:58 | 611 | 09:24 | 633 | 09:50 | 700 | 09:37 | 509 |
| Secondary & Chimney Fires | 08:32 | 1,596 | 08:48 | 1,480 | 08:37 | 1,693 | 09:12 | 2,461 | 08:55 | 1,330 |
| SS RTC LR | 08:08 | 106 | 09:04 | 73 | 09:28 | 92 | 09:14 | 86 | 08:55 | 95 |
| SS RTC Non LR | 08:40 | 422 | 08:12 | 408 | 08:17 | 423 | 08:47 | 486 | 08:51 | 464 |
| SS Other LR | 07:58 | 1,323 | 07:57 | 1,151 | 07:52 | 1,270 | 07:51 | 1,366 | 08:23 | 1,438 |
| SS Other Non LR | 07:05 | 601 | 07:26 | 486 | 06:46 | 603 | 06:26 | 616 | 07:14 | 606 |
| AFA Hospital | 05:49 | 509 | 05:55 | 472 | 05:58 | 363 | 06:20 | 395 | 06:37 | 433 |
| AFA Prison | 13:40 | 16 | 12:19 | 22 | 11:45 | 6 | 11:29 | 17 | 13:11 | 19 |
| AFA Hospital & Prison | 06:03 | 525 | 06:12 | 494 | 06:03 | 369 | 06:33 | 412 | 06:54 | 452 |
| AFA No Hospital & Prison | 06:55 | 2,171 | 06:59 | 2,154 | 06:55 | 2,413 | 07:04 | 2,723 | 07:23 | 3,182 |
| FA Other | 08:37 | 1,146 | 08:15 | 1,143 | 08:28 | 1,097 | 08:58 | 1,222 | 08:49 | 1,218 |
| Overall | 07:47 | 9,391 | 07:50 | 8,796 | 07:47 | 9,424 | 08:06 | 10,928 | 08:07 | 10,277 |
2nd Response
| 2019 | 2020 | 2021 | 2022 | 2023 | ||||||
|---|---|---|---|---|---|---|---|---|---|---|
| Incident Category | Response Time | N.of Responses | Response Time | N.of Responses | Response Time | N.of Responses | Response Time | N.of Responses | Response Time | N.of Responses |
| Fire Primary LR | 09:53 | 581 | 10:17 | 558 | 10:01 | 607 | 10:13 | 609 | 11:06 | 741 |
| Fire Primary Non LR | 12:46 | 156 | 12:54 | 161 | 13:37 | 184 | 13:57 | 192 | 14:01 | 148 |
| Secondary & Chimney Fires | 12:24 | 101 | 12:10 | 117 | 12:19 | 131 | 12:02 | 226 | 12:21 | 77 |
| SS RTC LR | 13:18 | 94 | 13:43 | 66 | 13:24 | 84 | 12:25 | 75 | 13:01 | 80 |
| SS RTC Non LR | 12:47 | 130 | 11:19 | 103 | 11:59 | 131 | 13:16 | 166 | 12:28 | 161 |
| SS Other LR | 15:09 | 113 | 14:30 | 91 | 15:17 | 151 | 15:36 | 133 | 15:12 | 183 |
| SS Other Non LR | 13:03 | 26 | 14:40 | 31 | 12:30 | 29 | 14:07 | 39 | 16:13 | 25 |
| AFA Hospital | 08:00 | 438 | 07:53 | 406 | 08:10 | 319 | 08:06 | 96 | 08:45 | 18 |
| AFA Prison | 18:11 | 16 | 17:32 | 22 | 17:58 | 6 | 18:02 | 17 | 17:48 | 17 |
| AFA Hospital & Prison | 08:22 | 454 | 08:23 | 428 | 08:21 | 325 | 09:36 | 113 | 13:08 | 35 |
| AFA No Hospital & Prison | 07:20 | 517 | 07:55 | 519 | 07:21 | 633 | 07:09 | 761 | 07:42 | 779 |
| FA Other | 09:10 | 331 | 08:53 | 303 | 09:15 | 287 | 09:14 | 272 | 09:55 | 308 |
| Overall | 09:49 | 2,503 | 09:53 | 2,377 | 09:59 | 2,562 | 10:13 | 2,586 | 10:39 | 2,537 |
Average Response Performance by District
Average Response Performance by Station Area
Mean response time measured from time assigned (Excluding call handling)