Optimisation Modelling - Greenfield Stations
Methodology
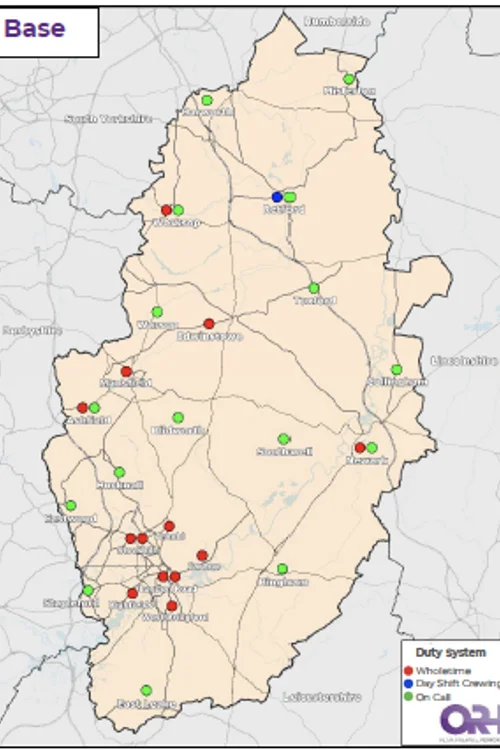
Using optimisation modelling, ORH identified the optimal configuration of stations using a ‘blank-canvas’ approach – stations could be located anywhere within Nottinghamshire. The modelling considered the same number of stations (24) and pumping appliances (30) by duty system as the current position. Locations and appliances have been optimised against life risk incidents, whilst removing any demand on the main 4 prisons of Lowdham Grange, Ranby, Whatton, HMP Prison.
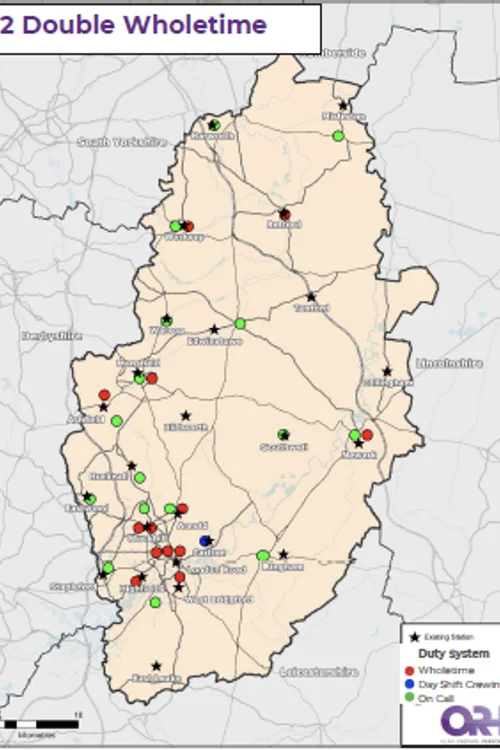
There are currently 13 wholetime, 1 day shift crewing and 16 on-call pumps operating across the county. NFRS currently operate with two double wholetime stations (London Road and Stockhill). ORH have created two optimal solutions:
- One where the requirement for two double wholetime stations continue to exist
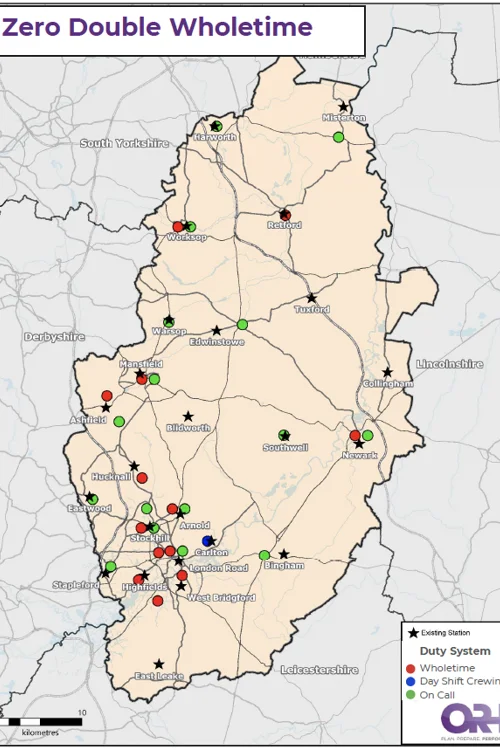
- One where the requirement double wholetime stations is removed completely (therefore maximising first response performance).
It is important to understand that the solution provided here is the mathematical best solution and does not take into account things like operational practices, political barriers or financial constraints.
Once the optimisation runs were completed and scenarios generated, simulation modelling was used to assess the impact on modelled response performance. For these configurations it has been assumed that the OC crews have availability as per averages of the current pumps.
Results
Many of the optimised locations are close to existing stations and the general spread of stations is similar to the current deployment.
The optimal deployments with two double wholetime stations would improve average first response by around 31 seconds and second response by around 16 seconds across NFRS. When the requirement for two double wholetime stations is removed, first response improves by 42 seconds in total, but second response degrades by 15 seconds from the original base.
The model favours positioning one of the double wholetime stations in the Mansfield area, rather than having both of them in City of Nottingham and notable new station locations have been identified in the areas near to:
- Clifton
- Ollerton junction
- Beckingham
Exact co-ordinates of greenfield locations are provided in the appendix.
Appliance Summary - Greenfield Optimisation Configurations
| District | Wholetime | Day Shift Crewing | On Call | Stations |
|---|---|---|---|---|
| Ashfield | 1 | 0 | 2 | 2 |
| Bassetlaw | 1 | 1 | 5 | 5 |
| Broxtowe | 1 | 0 | 2 | 3 |
| City of Nottingham | 4 | 0 | 0 | 2 |
| Gedling | 2 | 0 | 0 | 2 |
| Mansfield | 1 | 0 | 1 | 2 |
| Newark & Sherwood | 2 | 0 | 4 | 5 |
| Rushcliffe | 1 | 0 | 2 | 3 |
| Total | 13 | 1 | 16 | 24 |
| District | Wholetime | Day Shift Crewing | On Call | Stations |
|---|---|---|---|---|
| Ashfield | 1 | 0 | 2 | 3 |
| Bassetlaw | 2 | 0 | 3 | 4 |
| Broxtowe | 1 | 0 | 2 | 3 |
| City of Nottingham | 4 | 0 | 3 | 5 |
| Gedling | 1 | 1 | 1 | 2 |
| Mansfield | 2 | 0 | 1 | 2 |
| Newark & Sherwood | 1 | 0 | 3 | 3 |
| Rushcliffe | 1 | 0 | 1 | 2 |
| Total | 13 | 1 | 16 | 24 |
| District | Wholetime | Day Shift Crewing | On Call | Stations |
|---|---|---|---|---|
| Ashfield | 0 | 0 | 0 | 1 |
| Bassetlaw | 1 | -1 | -2 | -1 |
| Broxtowe | 0 | 0 | 0 | 0 |
| City of Nottingham | 0 | 0 | 3 | 3 |
| Gedling | -1 | 1 | 1 | 0 |
| Mansfield | 1 | 0 | 0 | 0 |
| Newark & Sherwood | -1 | 0 | -1 | -2 |
| Rushcliffe | 0 | 0 | -1 | -1 |
| Total | 0 | 0 | 0 | 0 |
| District | Wholetime | Day Shift Crewing | On Call | Stations |
|---|---|---|---|---|
| Ashfield | 2 | 0 | 1 | 3 |
| Bassetlaw | 2 | 0 | 3 | 4 |
| Broxtowe | 1 | 0 | 2 | 3 |
| City of Nottingham | 4 | 0 | 3 | 5 |
| Gedling | 1 | 1 | 1 | 2 |
| Mansfield | 1 | 0 | 2 | 2 |
| Newark & Sherwood | 1 | 0 | 3 | 3 |
| Rushcliffe | 1 | 0 | 1 | 2 |
| Total | 13 | 1 | 16 | 24 |
| District | Wholetime | Day Shift Crewing | On Call | Stations |
|---|---|---|---|---|
| Ashfield | 1 | 0 | -1 | 1 |
| Bassetlaw | 1 | -1 | -2 | -1 |
| Broxtowe | 0 | 0 | 0 | 0 |
| City of Nottingham | 0 | 0 | 3 | 3 |
| Gedling | -1 | 1 | 1 | 0 |
| Mansfield | 0 | 0 | 1 | 0 |
| Newark & Sherwood | -1 | 0 | -1 | -2 |
| Rushcliffe | 0 | 0 | -1 | -1 |
| Total | 0 | 0 | 0 | 0 |
Modelled Performance - Greenfield Optimisation Configurations
| District | Life-Risk Incidents | All Incidents | ||
|---|---|---|---|---|
| Average 1st | Average 2nd | % of 1st in 15 Minutes | Average 1st | |
| Service-Wide | 7:31 | 11:25 | 93.2% | 7:32 |
| Ashfield | 8:58 | 13:14 | 90.9% | 8:55 |
| Bassetlaw | 8:05 | 18:47 | 88.7% | 8:52 |
| Broxtowe | 7:11 | 10:49 | 96.2% | 7:10 |
| City of Nottingham | 5:32 | 7:51 | 99.7% | 5:23 |
| Gedling | 7:17 | 9:39 | 97.1% | 7:51 |
| Mansfield | 6:36 | 6:39 | 98.7% | 6:57 |
| Newark & Sherwood | 10:38 | 16:35 | 81.0% | 11:19 |
| Rushcliffe | 10:30 | 13:36 | 82.4% | 10:38 |
| District | Life-Risk Incidents | All Incidents | ||
|---|---|---|---|---|
| Average 1st | Average 2nd | % of 1st in 15 Minutes | Average 1st | |
| Service-Wide | -0:31 | -0:16 | -0.9% | -0:35 |
| Ashfield | -0:37 | +0:46 | -2.9% | -0:24 |
| Bassetlaw | -0:54 | +2:19 | -0.5% | -0:46 |
| Broxtowe | -0:32 | -0:48 | 0.8% | -0:33 |
| City of Nottingham | -1:12 | -0:35 | 1.0% | -1:16 |
| Gedling | +0:22 | -1:14 | -0.2% | +0:19 |
| Mansfield | -0:41 | -5:31 | 0.8% | -0:57 |
| Newark & Sherwood | +0:49 | +0:41 | -5.3% | +1:01 |
| Rushcliffe | +0:44 | +0:43 | -4.7% | +0:50 |
| District | Life-Risk Incidents | All Incidents | ||
|---|---|---|---|---|
| Average 1st | Average 2nd | % of 1st in 15 Minutes | Average 1st | |
| Service-Wide | 7:20 | 11:56 | 93.6% | 7:23 |
| Ashfield | 7:53 | 13:11 | 92.5% | 7:52 |
| Bassetlaw | 8:05 | 18:48 | 88.6% | 8:52 |
| Broxtowe | 7:10 | 10:43 | 96.3% | 7:09 |
| City of Nottingham | 5:22 | 8:31 | 99.9% | 5:16 |
| Gedling | 7:13 | 9:46 | 97.6% | 7:45 |
| Mansfield | 6:50 | 9:53 | 98.4% | 7:13 |
| Newark & Sherwood | 10:39 | 16:50 | 80.7% | 11:21 |
| Rushcliffe | 9:50 | 13:16 | 86.0% | 9:58 |
| District | Life-Risk Incidents | All Incidents | ||
|---|---|---|---|---|
| Average 1st | Average 2nd | % of 1st in 15 Minutes | Average 1st | |
| Service-Wide | -0:42 | +0:15 | -0.5% | 0:44 |
| Ashfield | -1:42 | +0:43 | -1.3% | -1:27 |
| Bassetlaw | -0:54 | +2:20 | -0.6% | -0:46 |
| Broxtowe | -0:33 | -0:54 | 0.9% | -0:34 |
| City of Nottingham | -1:22 | +0:05 | 1.2% | -1:23 |
| Gedling | +0:18 | -1:07 | 0.3% | +0:13 |
| Mansfield | -0:27 | -2:17 | 0.5% | -0:41 |
| Newark & Sherwood | +0:50 | +0:56 | -5.6% | +1:03 |
| Rushcliffe | +0:04 | +0:23 | -1.1% | +0:10 |
| Street Address | X | Y | 2 Double Wholetime Locations | 0 Double Wholetime Locations | ||||
|---|---|---|---|---|---|---|---|---|
| PWT | PDC | POC | PWT | PDC | POC | |||
| Mansfield Rd near Church Crescent | 457870 | 345342 | 1 | 0 | 1 | 1 | 0 | 1 |
| Intersection of Ollerton RD & Main St | 465559 | 367605 | 0 | 0 | 1 | 0 | 0 | 1 |
| Lenton Boulevard near Recreation Ground | 455511 | 340070 | 1 | 0 | 0 | 1 | 0 | 0 |
| Intersection of Ratcliffe Gate & St Peter's Way | 454218 | 361008 | 2 | 0 | 0 | 1 | 0 | 1 |
| On North Gate near to Water Lane | 479871 | 354207 | 1 | 0 | 1 | 1 | 0 | 1 |
| Intersection of Eastgate & Carlton Rd | 458557 | 379301 | 1 | 0 | 1 | 1 | 0 | 1 |
| Intersection of Arlington Way & Albert Rd | 470726 | 380709 | 1 | 0 | 0 | 1 | 0 | 0 |
| Intersection of Huntingdon St & Kent St | 457619 | 340273 | 2 | 0 | 0 | 1 | 0 | 1 |
| Intersection of Bulwell High Rd & Main St | 454032 | 345373 | 0 | 0 | 1 | 0 | 0 | 1 |
| Intersection of Lammas Rd & Carsic Lane | 449251 | 359002 | 1 | 0 | 0 | 1 | 0 | 0 |
| Melton Rd near to Charnwood Grove | 458305 | 337218 | 1 | 0 | 0 | 1 | 0 | 0 |
| On B6006 by Nether St | 453073 | 336673 | 1 | 0 | 0 | 1 | 0 | 0 |
| Scrooby Rd near Church | 462459 | 391514 | 0 | 0 | 1 | 0 | 0 | 1 |
| Roundabout where Burton Rd meets Carlton Hill | 461357 | 341451 | 0 | 1 | 0 | 0 | 1 | 0 |
| Intersection of Watnall Rd & Derbyshire Lane | 453487 | 349068 | 0 | 0 | 1 | 1 | 0 | 0 |
| Intersection of Green Ln & Southchurch Drive | 455345 | 334149 | 0 | 0 | 1 | 1 | 0 | 0 |
| Intersection of Nuthall Rd & Stockhill Ln | 454125 | 343041 | 1 | 0 | 1 | 1 | 0 | 1 |
| Near to Bingham Interchange Roundabout | 468206 | 339693 | 0 | 0 | 1 | 0 | 0 | 1 |
| Intersection of Nottigham Rd & Dovecote Rd | 447537 | 346507 | 0 | 0 | 1 | 0 | 0 | 1 |
| Intersection of Hickings Lane & Ewe Lanb Lane | 449712 | 338299 | 0 | 0 | 1 | 0 | 0 | 1 |
| Sherwood St near to High St | 456702 | 367890 | 0 | 0 | 1 | 0 | 0 | 1 |
| Kingsway near park | 450722 | 355881 | 0 | 0 | 1 | 0 | 0 | 1 |
| Intersection of Station Rd & Newark Rd | 470536 | 354242 | 0 | 0 | 1 | 0 | 0 | 1 |
| Roundabout where Beckingham Rd meets A631 | 477129 | 390218 | 0 | 0 | 1 | 0 | 0 | 1 |