Optimisation Modelling - Existing Stations
Optimisation Modelling:
- Service-wide Existing Locations
- Service-Wide Greenfield
Service Input:
- General thoughts
- What is operationally possible?
- What is politically viable?
Bespoke Configurations Incorporating:
- Station Closures / Mergers / Moves
- Changes to crewing (Upgrade / Downgrade)
- New Locations
Any Potential changes should be simulated to test impacts on response performance
Optimisation Methodology
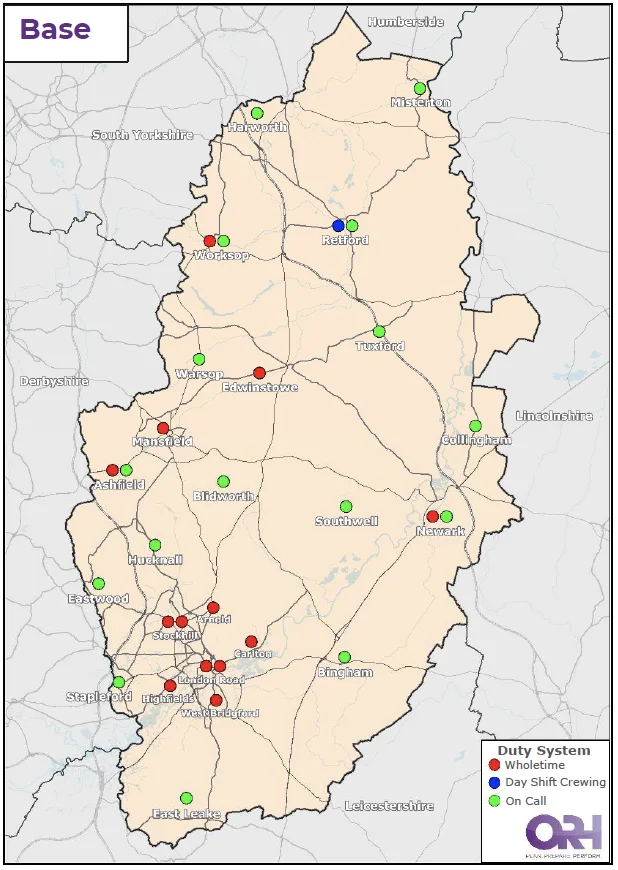
NFRS asked ORH to look at the optimal distribution of pumping appliances across existing stations whilst maintaining the existing number of appliances. Appliances have been optimised against first response to life risk incidents, service-wide.
There are currently 13 wholetime, 1 day shift crewing and 16 on-call pumps operating across the county. NFRS currently operate with two double wholetime stations (London Road and Stockhill). ORH have therefore created optimal solutions:
- One where two double wholetime stations continue to exist
- One where the constraint of two double wholetime stations is removed
Once the optimisation runs were completed and scenarios generated, simulation modelling was used to assess the impact on modelled response performance. For these configurations it has been assumed that the OC crews maintain their current availability once moved to their new locations.
Optimisation Results
If two double wholetime stations exist, modelling has shown it is not possible to improve first response performance by re-distributing appliances across existing locations. This shows that pumps are already well positioned to achieve first response performance.
It is possible to improve first response performance by removing the double wholetime constraint, and redistributing these wholetime pumps across the county in an optimal manner by:
- Swapping the second WT pump at London Road with the OC pump at Hucknall
- Swapping the second WT pump at Stockhill with the OC pump at Stapleford
It is worth noting that this improvement in first response is at the expense of second response performance.
Optimal Configuration
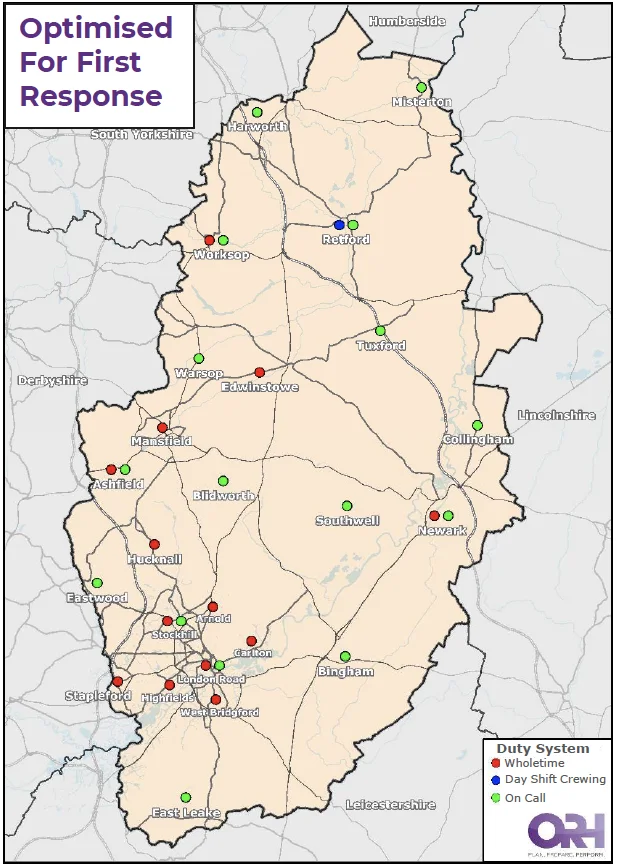
This optimal deployment involves the following changes from the base:
- Swapping the second WT pump at London Road with the OC pump at Hucknall
- Swapping the second WT pump at Stockhill with the OC pump at Stapleford
Modelled Performance
In this scenario first reponse performance to Life-Risk incidents improves by 6 seconds service-wide, but second response degrades by 36 seconds
| District | Life-Risk Incidents | All Incidents | ||
|---|---|---|---|---|
| Average 1st | Average 2nd | % of 1st in 15 Minutes | Average 1st | |
| Service-Wide | 7:56 | 12:17 | 94.2% | 8:03 |
| Ashfield | 8:47 | 12:19 | 95.0% | 8:30 |
| Bassetlaw | 8:59 | 16:28 | 89.2% | 9:38 |
| Broxtowe | 6:47 | 10:43 | 96.4% | 6:53 |
| City of Nottingham | 6:53 | 9:55 | 98.8% | 6:48 |
| Gedling | 6:51 | 11:03 | 97.6% | 7:26 |
| Mansfield | 7:16 | 12:09 | 97.9% | 7:53 |
| Newark & Sherwood | 9:49 | 15:55 | 86.2% | 10:18 |
| Rushcliffe | 9:49 | 13:12 | 86.8% | 9:51 |
| District | Life-Risk Incidents | All Incidents | ||
|---|---|---|---|---|
| Average 1st | Average 2nd | % of 1st in 15 Minutes | Average 1st | |
| Service-Wide | -0:06 | +0:36 | 0.1% | -0:04 |
| Ashfield | -0:48 | -0:09 | 1.2% | -0:49 |
| Bassetlaw | 0:00 | 0:00 | 0.0% | 0:00 |
| Broxtowe | -0:56 | -0:54 | 1.0% | -0:50 |
| City of Nottingham | +0:09 | +1:29 | 0.1% | +0:09 |
| Gedling | -0:04 | +0:10 | 0.3% | -0:06 |
| Mansfield | -0:01 | -0:01 | 0.0% | -0:01 |
| Newark & Sherwood | 0:00 | +0:01 | -0.1% | 0:00 |
| Rushcliffe | +0:03 | +0:19 | -0.3% | +0:03 |