NFCC Risk Methodology
NFCC Dwelling Fire Risk Methodology
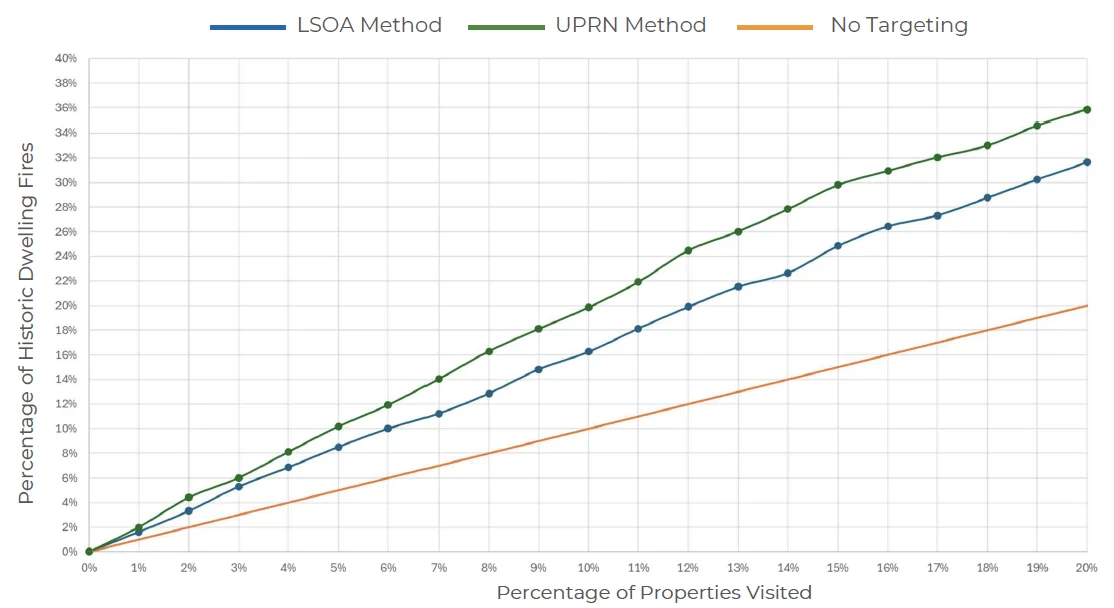
The National Fire Chiefs Council (NFCC) in collaboration with ORH have produced a methodology for dwelling fire risk categorisation as part of NFCC’s Definition of Risk project. The overall objective as defined by NFCC was “to deliver an evidence-based and consistent methodology for determining ‘level of risk’”. NFCC and ORH took a datadriven approach to researching the risk factors that underpin the likelihood and consequence of dwelling fires.
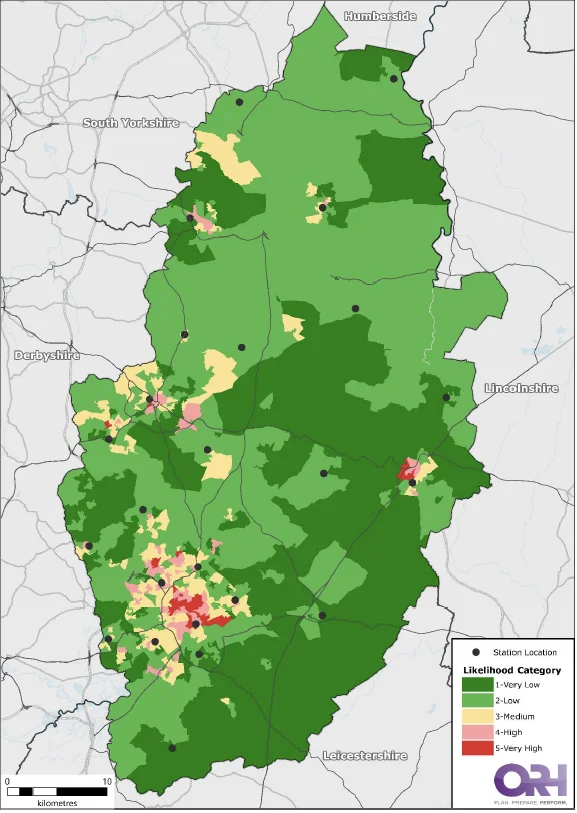
The step-by-step framework brings together national modelling on the likelihood and consequence of dwelling fires to develop a ranking of all Lower Super Output Areas (LSOAs) in a fire service, which can then form the local categorisation of risk. This is primarily based on place and property data, rather than individuals. ORH has applied this methodology, using publicly available data, to determine risk in Nottinghamshire FRS.
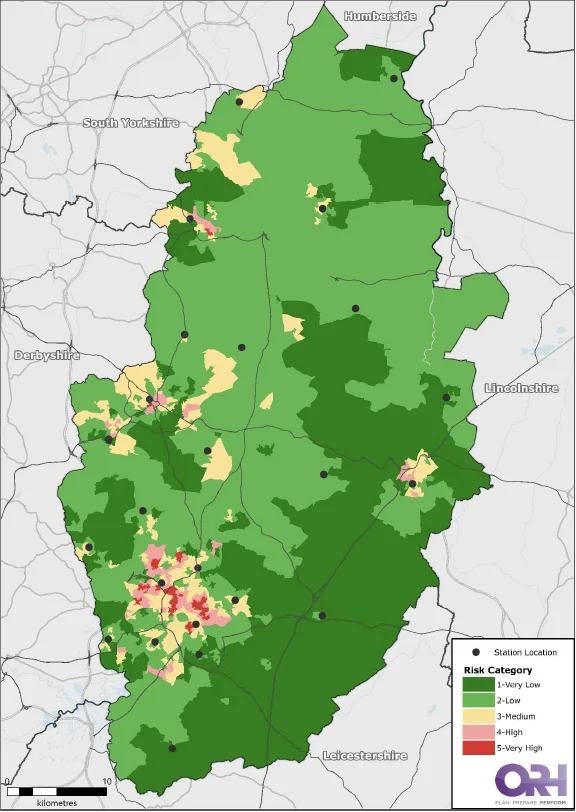
The key outcome is a risk score for each LSOA in Nottinghamshire. Based on the national analysis, LSOAs are categorised as follows:
- Very High = Top 5% of LSOAs (1st to 5th percentile)
- High = Next 10% of LSOAs (6th to 15th percentile)
- Medium = Next 25% of LSOAs (16th to 40th percentile)
- Low = Next 40% of LSOAs (41st to 80th percentile)
- Very Low = Bottom 20% of LSOAs (81st to 100th percentile)
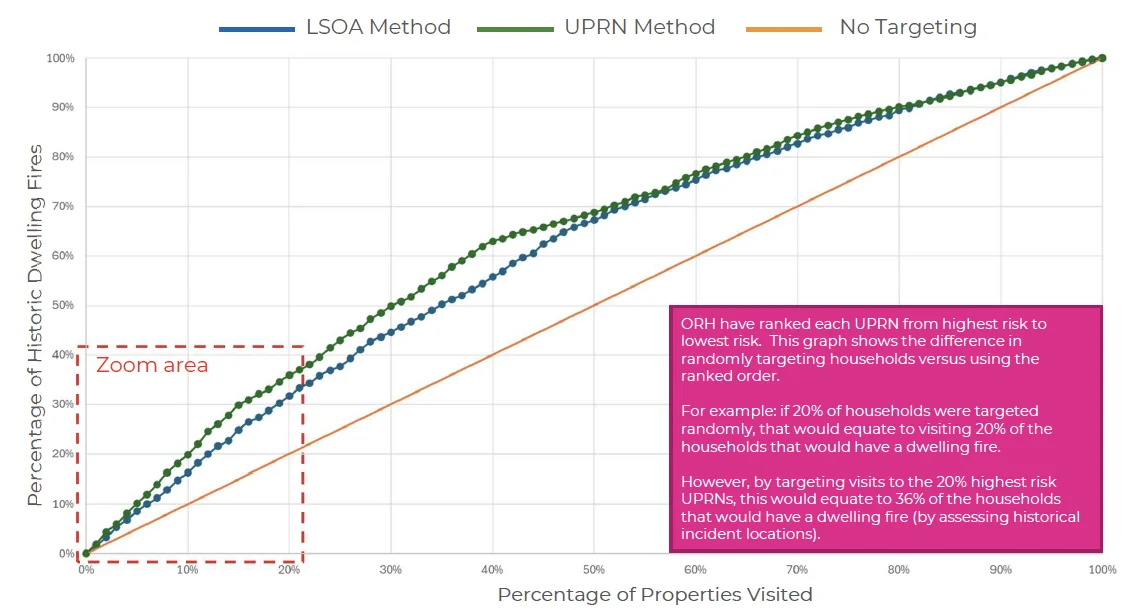
These proportions are designed so that it is easy to identify LSOAs with likelihood scores that stand out across an individual fire service. Separately, ORH have also supplied the NFCC UPRN based risk modelling alongside shape files for the NFRS GIS team to utilise internally.
| Data Field | Direction of Relationship | National Weighting |
|---|---|---|
| Probability of Ownership / Shared Ownership | Negative | 20.4% |
| Probability of Living in Flat | Positive | 13.6% |
| Probability Living in Semi Detached | Negative | 11.3% |
| Probability of Having no Car or Van | Positive | 11.3% |
| Probability No Children in Household | Negative | 5.4% |
| Probability of Having One or Less Rooms than Required | Positive | 5.4% |
| Probability of being Unemployed | Positive | 4.1% |
| IMD Employment Ranking | Negative (as data is a ranking) | 8.1% |
| IMD Living Environment Ranking | 6.8% | |
| IMD Crime Ranking | 5.4% | |
| IMD Health Deprivation and Disability Ranking | 5.4% | |
| IMD Income Ranking | 2.7% |
| Data Field | Direction of Relationship | National Weighting |
|---|---|---|
| Probability Property is Council Tax Band A or B | Positive | 19.0% |
| Probability of Individula being in Very Bad Health | Positive | 15.4% |
| Probability of Individual is Unemployed | Positive | 12.3% |
| Probability of Individual Working Full Time | Negative | 9.8% |
| Probability that Individuals' Main Language is not English | Positive | 8.9% |
| Probability of Dependent Children Living in Household | Positive | 7.5% |
| IMD Crime Ranking | Negative (as data is a ranking) | 13.7% |
| IMD Living Environment Ranking | 13.5% |
The NFCC method uses a range of public available data at LSOA and UPRN level which includes potential influencing factors:
- local environment, social and economic factors;
- property factors, such as type, condition and occupancy;
- data on household and individuals in terms of their behavioural patterns;
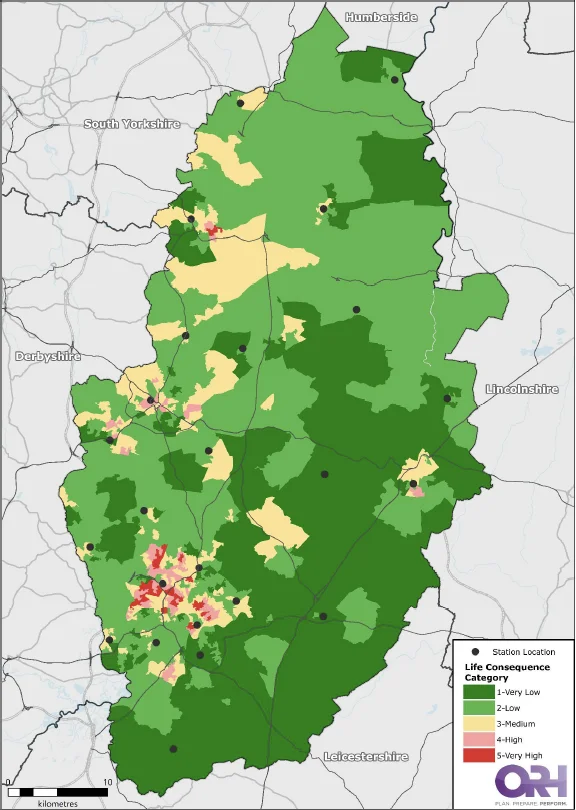
Some of the factors are positively correlated with likelihood or consequence for example probability of individual being in Very Bad Health – Dwelling fires that occur in LSOAs with a higher percentage of people who are in very bad health are likely to have a greater consequence on life.
Other factors are negatively correlated for example Probability of Individual Working Full Time – Dwelling fires that occur in LSOAs where fulltime working is higher are likely to have a lesser consequence on life.
Further information on this methodology can be found in the published NFCC documentation.
LSOA Dwelling Fire Risk Analysis (5-year sample)
| Category | Category Description |
LSOAs | Min Score | Max Score | Dwelling Fires | Population | Incidents with Victims | DFs per LSOA per Year | DFs per 1,000 people per year | Incs with Victims per LSOA per Year | Inc with Victims per 1,000 people year |
|---|---|---|---|---|---|---|---|---|---|---|---|
| 5 - Very High | Top 5% of percentile) LSOAs (1st to 5th) |
33 | 66.86 | 83.57 | 315 | 60,143 | 35 | 1.91 | 1.05 | 0.21 | 0.12 |
| 4 - High | Next 10% percentile) of LSOAs (6th to 15th) |
68 | 53.69 | 66.05 | 577 | 121,763 | 62 | 1.70 | 0.95 | 0.18 | 0.10 |
| 3 - Medium | Next 25% percentile) of LSOAs (16th to 40th) |
170 | 31.10 | 53.69 | 1,027 | 294,066 | 108 | 1.21 | 0.70 | 0.13 | 0.07 |
| 2 - Low | Next 40% percentile) of LSOAs (41st to 80th) |
272 | 8.69 | 31.07 | 839 | 457,725 | 91 | 0.62 | 0.37 | 0.07 | 0.04 |
| 1 - Very Low | Bottom 20 percentile) % of LSOAs (81st to 100th) |
136 | 1.37 | 8.66 | 257 | 227,427 | 28 | 0.38 | 0.23 | 0.04 | 0.02 |
| Total | 679 | 1.37 | 83.57 | 3,015 | 1,161,124 | 324 | 0.89 | 0.52 | 0.10 | 0.06 | |
The LSOA categorisation correlates well to the number of Victims and Dwelling Fires per LSOA and per 1,000 people.
LSOA Dwelling Fire Risk Analysis (5-year sample)
... Awaiting data ...
NFCC RTC Risk Methodology
NFCC and ORH have also produced a report into the likelihood, consequence and risk of Road Traffic Collisions (RTCs). The project required multiple data sources, to calculate the likelihood of RTCs by type of road.
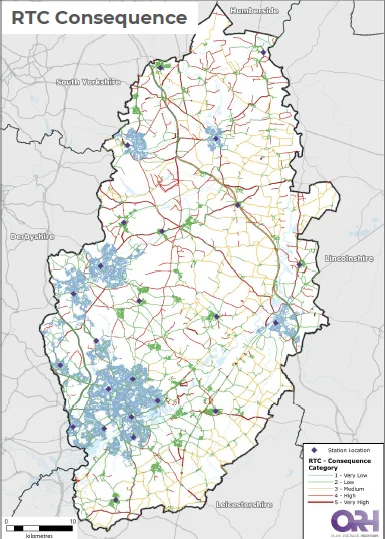
NFCC/ORH analysed the likelihood and consequence of RTCs in terms of the total number, relative proportions and annual rates per kilometre of road. Stats19 data fields were then examined in relation to the effect of incidents on people, vehicles, the road network and potentially the responding FRS. Different metrics for classifying incident consequence were tested before finalising an approach that provided a suitable breakdown of high, medium or low consequence incidents.
A four-factor categorisation has been applied to every segment of road in determining the final likelihood, consequence and risk values:
- Road class (Motorway, Primary A road, Local Road, etc)
- Road Type (single carriageway, junctions, etc)
- Road Speed (posted speed limit)
- Urban/Rural Classification (ONS classification, simplified to four categories: Urban conurbations, Urban towns, Rural towns, Rural villages))
NFCC RTC Risk Analysis
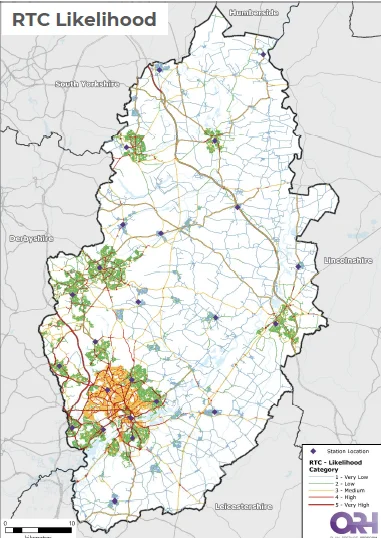
| Likelihood Score | Length (km) | % of Road Length | National Comparison |
|---|---|---|---|
| Very Low | 1,925 | 31% | 38% |
| Low | 1,921 | 31% | 30% |
| Medium | 1,615 | 26% | 22% |
| High | 597 | 10% | 9% |
| Very High | 90 | 1% | 1% |
| Consequence Score | Length (km) | % of Road Length | National Comparison |
|---|---|---|---|
| Very Low | 2,727 | 44% | 39% |
| Low | 2,050 | 33% | 29% |
| Medium | 697 | 11% | 21% |
| High | 630 | 10% | 9% |
| Very High | 45 | 1% | 1% |
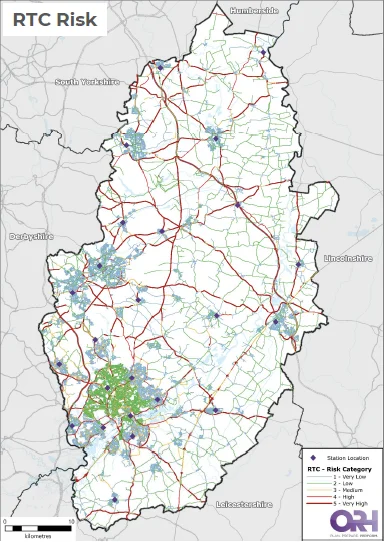
| Risk Category | Length (km) | % of Road Length | National Comparison |
|---|---|---|---|
| Very Low | 2,719 | 44% | 40% |
| Low | 2,047 | 33% | 39% |
| Medium | 548 | 9% | 7% |
| High | 456 | 7% | 8% |
| Very High | 377 | 6% | 6% |
Proportions of roads within risk categories in Nottinghamshire is broadly in line with national profile on all scores
NFCC Other Building Fires Methodology
The National Fire Chiefs Council (NFCC) in collaboration with ORH have produced a methodology for Other Building Fires (OBFs) risk categorisation as part of NFCC’s Definition of Risk project. The overall objective as defined by was “to deliver an evidence-based and consistent methodology for determining ‘level of risk’ that also provides a national benchmarking capability”.
NFCC and ORH worked collaboratively to complete this report, taking a data-driven approach to researching the likelihood and consequence of OBFs, and the influencing factors that underpin the risk of these incidents. The approach involved collecting incident data from IRS, Ordnance Survey data on building locations and property types that NFCC/ORH grouped into 23 appropriate building categories, and publicly available information on a wide range of potential influencing factors.
This methodology has been published in draft form and is awaiting final release from NFCC. Therefore, results should be treated as draft and could be subject to change in the future, depending on how things are finalised with the broader NFCC approach.
Separately, ORH have supplied the NFCC other building fires full output for the NFRS GIS team to utilise internally.
NFCC Other Building Fires
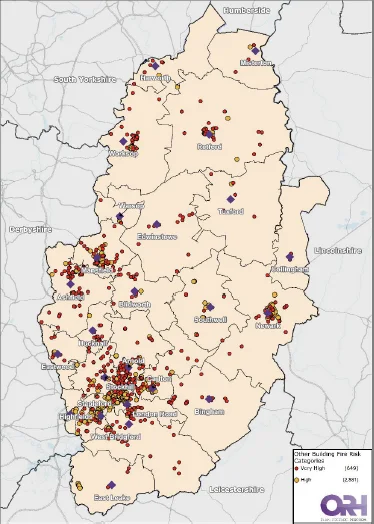
Examples of Buildings in the Very High category include:
- Prisons
- Hospitals
- Care Homes
Examples of Buildings in the High category include:
- HMO
- Residential Accommodation
- Sheltered Accommodation